📊 BBTC/USDT Market Update – Double Top Breakdown & Key Support Level
Welcome to today’s analysis! Let’s break down the Bitcoin ( BTC) chart, focusing on the double top pattern and key levels.
⸻
🌐 Overview: Double Top Formation & Breakdown
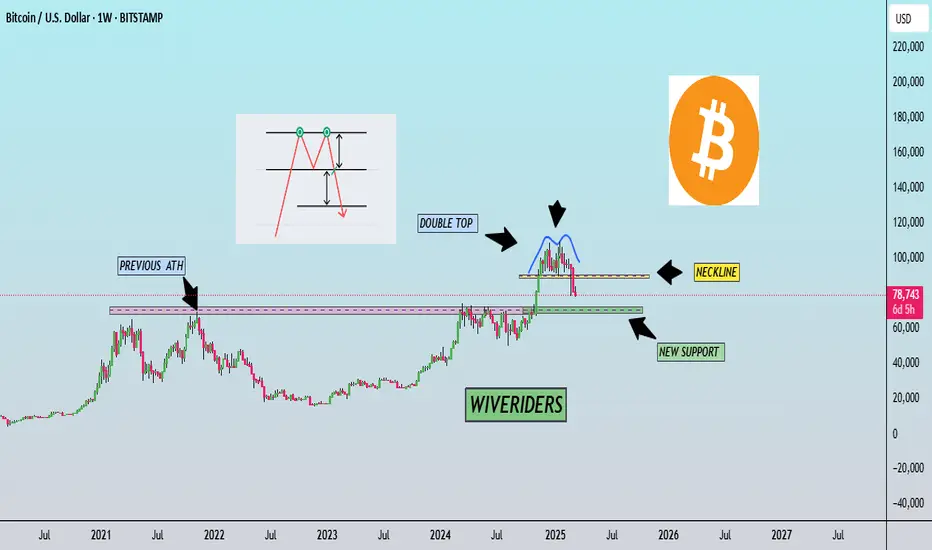
📉BTC has formed a double top pattern and has broken the neckline (yellow level).
🔄 Current Scenario:
• The double top pattern suggests a bearish move, with a projected target at the green support level.
• The green support zone aligns with the previous ATH from the last bull run, making it a key area for potential price stabilization.
• If buyers step in at this support, we could see a bounce and possible bullish reversal.
⸻
🔑 Key Levels to Watch
🟡 Neckline (Broken Support): Confirmed breakdown, acting as new resistance.
🟢 Support Zone: Green Level (Previous ATH, potential stabilization area).
⸻
🛠️ Trade Scenarios
📌 Bullish Scenario (Support Holds & Price Bounces Up)
• IfBTC stabilizes at the green support, buyers may step in, leading to a potential recovery move.
• Confirmation of bullish strength could come from a higher low formation at this level.
📌 Bearish Scenario (Break Below Green Support)
• IfBTC fails to hold the green support zone, further downside could occur, potentially testing lower support areas.
• A confirmed breakdown below this level would signal continued bearish momentum.
⸻
📌 Conclusion
BTC has broken the neckline of a double top pattern, and its projected target aligns with the green support zone (previous ATH level). This area is critical for potential price stabilization—if buyers defend it, we could see a rebound and bullish continuation. However, if it breaks down, further losses may follow.
Welcome to today’s analysis! Let’s break down the Bitcoin (
BTC) chart, focusing on the double top pattern and key levels.⸻
🌐 Overview: Double Top Formation & Breakdown
📉
BTC has formed a double top pattern and has broken the neckline (yellow level).🔄 Current Scenario:
• The double top pattern suggests a bearish move, with a projected target at the green support level.
• The green support zone aligns with the previous ATH from the last bull run, making it a key area for potential price stabilization.
• If buyers step in at this support, we could see a bounce and possible bullish reversal.
⸻
🔑 Key Levels to Watch
🟡 Neckline (Broken Support): Confirmed breakdown, acting as new resistance.
🟢 Support Zone: Green Level (Previous ATH, potential stabilization area).
⸻
🛠️ Trade Scenarios
📌 Bullish Scenario (Support Holds & Price Bounces Up)
• If
BTC stabilizes at the green support, buyers may step in, leading to a potential recovery move.• Confirmation of bullish strength could come from a higher low formation at this level.
📌 Bearish Scenario (Break Below Green Support)
• If
BTC fails to hold the green support zone, further downside could occur, potentially testing lower support areas.• A confirmed breakdown below this level would signal continued bearish momentum.
⸻
📌 Conclusion
BTC has broken the neckline of a double top pattern, and its projected target aligns with the green support zone (previous ATH level). This area is critical for potential price stabilization—if buyers defend it, we could see a rebound and bullish continuation. However, if it breaks down, further losses may follow.
면책사항
해당 정보와 게시물은 금융, 투자, 트레이딩 또는 기타 유형의 조언이나 권장 사항으로 간주되지 않으며, 트레이딩뷰에서 제공하거나 보증하는 것이 아닙니다. 자세한 내용은 이용 약관을 참조하세요.
면책사항
해당 정보와 게시물은 금융, 투자, 트레이딩 또는 기타 유형의 조언이나 권장 사항으로 간주되지 않으며, 트레이딩뷰에서 제공하거나 보증하는 것이 아닙니다. 자세한 내용은 이용 약관을 참조하세요.