
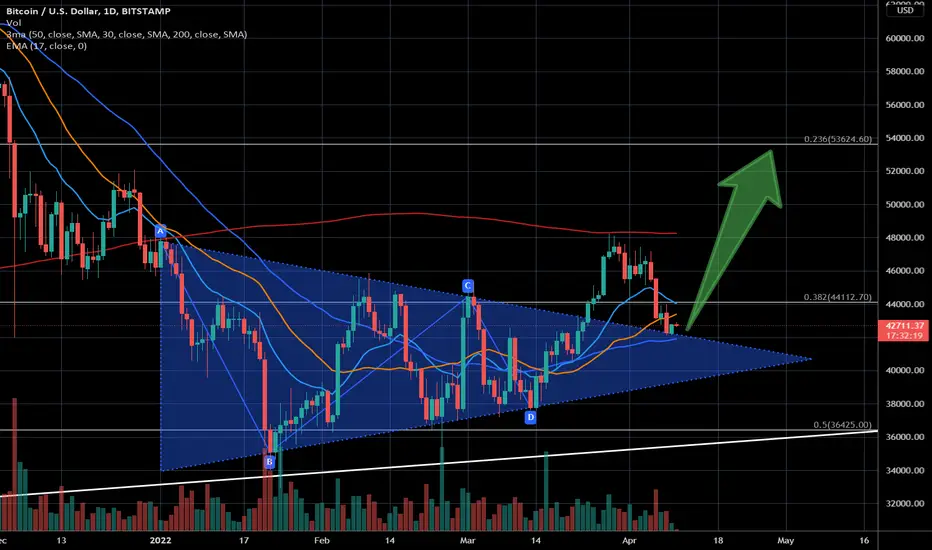
Looks like we can open the bullish case.
Could be a nice long setup. Valid on the daily and weekly timeframe. If the price drifts further down, I would see this setup invalidated.
- Triangle formation has broken to the upper side
- Re-Test of the triangle on the upside on Friday
- Price above still above the 50 SMA
- Short-term MAs are bullish aligned (17 EMA > 30 SMA > 50 SMA)
Could be a nice long setup. Valid on the daily and weekly timeframe. If the price drifts further down, I would see this setup invalidated.
노트
Unfortunately, the triangle didn't work. I've adjusted the shape now and see what we've got: A rising channel. But this could be considered also as a bearish flag. However from the current position it seems to be more likely that BTC is doing a bounce to the upside. But it's questionable if BTC can leave the channel ...노트
Looks like tomorrow we can see a pump in BTC - or a dump. ;) I'm expecting rather a pump, but could also be wrong ...
노트
Yesterday's assumption was wrong - it went south. But I've re-drawn the channel now because it has confirmed some significant points on the chart. The upward channel seems to be nevertheless still valid. Waiting for a bounce to the upside of this channel:
관련 발행물
면책사항
해당 정보와 게시물은 금융, 투자, 트레이딩 또는 기타 유형의 조언이나 권장 사항으로 간주되지 않으며, 트레이딩뷰에서 제공하거나 보증하는 것이 아닙니다. 자세한 내용은 이용 약관을 참조하세요.
면책사항
해당 정보와 게시물은 금융, 투자, 트레이딩 또는 기타 유형의 조언이나 권장 사항으로 간주되지 않으며, 트레이딩뷰에서 제공하거나 보증하는 것이 아닙니다. 자세한 내용은 이용 약관을 참조하세요.