
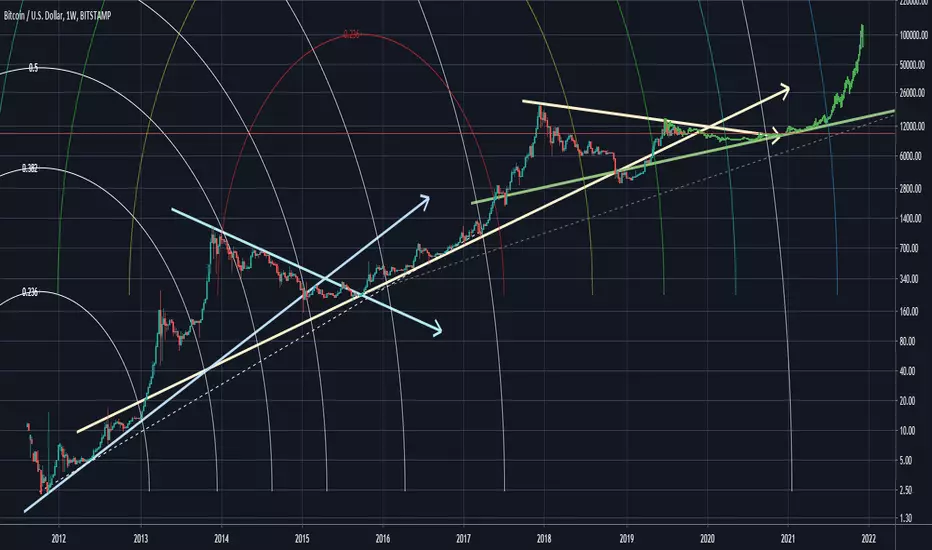
Just playing around with a crazy wild assumption of past patterns repeating themselves. :P
노트
Reaching the next ATH in Dec'21, after an initial dump to 8kUSD followed by a long painful somewhat-sideways drag around 8-9k, then followed by a long but steady/"gentle" bull market towards 12k, before going parabolic around May-Jun'21.노트
A much older speculative long-term price prediction for BTCUSD: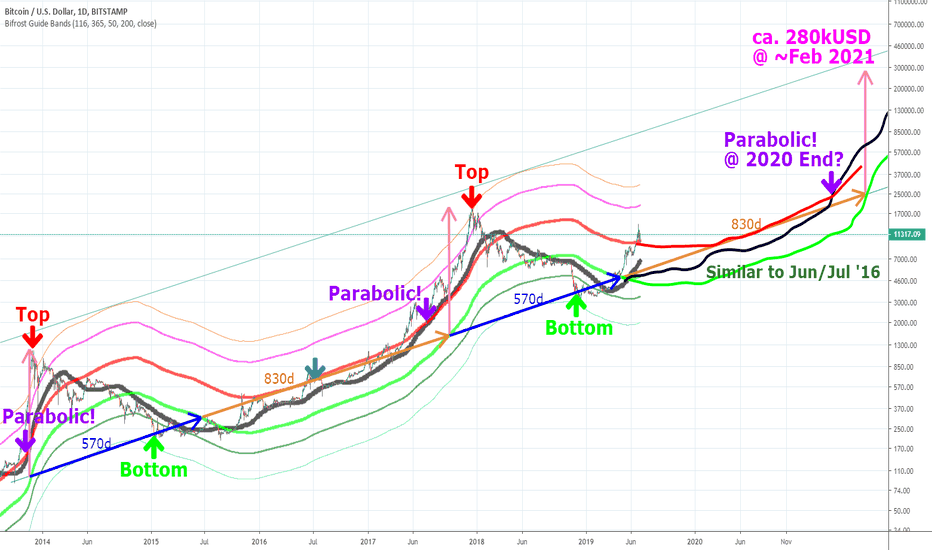
노트
Will this highly speculative long-term fractal/fib based BTC/USD price action (conforming well so far) continue?
i.e. reach 11k-12k USD, then gradual decline down to 8k USD again around 02Mar20 to inflict more pain on the bulls and eliminating more weak-hands, before going relatively sideways until 13Jul20, then a fakeout to, 11.8k USD around 11Jan21 before crashing below 9.9k USD before the next actual parabolic rise commences
around Mar21 eventually hiting a new all-time-high at ~120kUSD.

면책사항
해당 정보와 게시물은 금융, 투자, 트레이딩 또는 기타 유형의 조언이나 권장 사항으로 간주되지 않으며, 트레이딩뷰에서 제공하거나 보증하는 것이 아닙니다. 자세한 내용은 이용 약관을 참조하세요.
면책사항
해당 정보와 게시물은 금융, 투자, 트레이딩 또는 기타 유형의 조언이나 권장 사항으로 간주되지 않으며, 트레이딩뷰에서 제공하거나 보증하는 것이 아닙니다. 자세한 내용은 이용 약관을 참조하세요.