
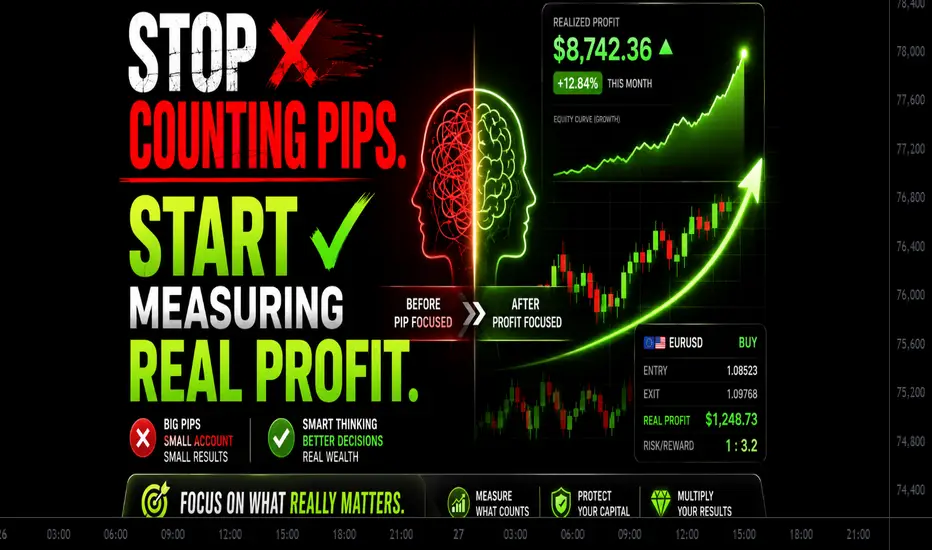
Stop Measuring Your Trading Performance in Percentages or Pips
Most traders track their performance the wrong way. They obsess over pip counts, celebrate percentage returns, and compare account balances. None of that tells you whether you are actually trading well. Today I want to show you a better way to measure your results, one that professional traders and prop firms actually use.
This article is written for shorter-term traders who typically hold one to three positions at a time. If you manage a diversified stock portfolio or a hedge fund with dozens of assets, this may not apply directly to you. But if you are a retail trader managing your own account, read this carefully because it will change how you look at your performance.
Why Percentages and Pips Are Misleading
Here is the problem with measuring returns in percentages. A 100% return on a $500 account means you made $500. A 20% return on a $50,000 account means you made $10,000. Which trader performed better? The percentage says the first one. The reality says the second one.
Percentages look impressive on paper but they do not reflect the actual skill or risk involved in making those returns.
Pips have the same problem. A trader risking 50 pips to make 20 pips is performing very differently from a trader risking 10 pips to make 30 pips, even if both made the same number of pips in total. The pip count alone tells you nothing meaningful.
Every trader has a different account size, a different risk tolerance, and a different position sizing approach. Comparing performance using percentages or pips between two different traders is like comparing apples to oranges. It does not work.
The Right Way to Measure Performance: R
The most accurate and useful way to track your trading performance is through something called R, which stands for your risk to reward ratio across all your trades.
R is simply your total profits divided by your total losses over a series of trades.
If you made $100,000 in a year but lost $50,000, your R value is 2. That means for every dollar you lost, you made two dollars back. A 3R track record means you made three dollars for every dollar lost.
This number is what actually matters. It tells you whether your strategy is working, whether your risk management is sound, and whether you are making more than you are losing in a way that is sustainable over time.
Here is a real example using 20 trades with fixed risk:

Trade 01: +3R (Winner)
Trade 02: -1R (Loser)
Trade 03: -1R (Loser)
Trade 04: -1R (Loser)
Trade 05: +3R (Winner)
Trade 06: +3R (Winner)
Trade 07: -1R (Loser)
Trade 08: -1R (Loser)
Trade 09: +5R (Winner)
Trade 10: +4R (Winner)
Trade 11: +2R (Winner)
Trade 12: -1R (Loser)
Trade 13: -1R (Loser)
Trade 14: -1R (Loser)
Trade 15: +3R (Winner)
Trade 16: +6R (Winner)
Trade 17: -1R (Loser)
Trade 18: -1R (Loser)
Trade 19: -1R (Loser)
Trade 20: +4R (Winner)
Total Wins: 33R
Total Losses: 11R
Overall R: 3R (33 divided by 11 = 3)
Notice something important in that example. Out of 20 trades, 11 were losers and only 9 were winners. That means this trader lost on 55% of their trades and still came out with a 3R overall result. This is exactly why win rate alone means nothing. What matters is how much you make when you are right compared to how much you lose when you are wrong.
Account Size Does Not Tell the Full Story
Here is something most traders do not think about. Due to leverage, a trader with $1,000 in their account can trade a similar position size to a trader with $20,000 in their account. Account balance is not a reliable indicator of how much risk someone is taking or how skilled they are.
You do not need a large account balance to trade meaningful size. You need a clear understanding of your risk per trade.
For this reason, keeping all your trading capital in one account makes very little sense. Most of it can sit in a separate savings or investment account earning interest while you only keep what you need to trade your desired position size. The account balance your broker sees is not a reflection of your overall financial position or your trading ability.
Risk Tolerance Is Personal
One trader might be comfortable risking $200 per trade. Another might risk $2,000. Neither is right or wrong as long as it fits within their personal financial situation and does not affect their ability to make clear decisions.
A simple rule to check if you are risking too much: if your open trades are keeping you awake at night, your position size is too large.
Risk tolerance grows naturally as your skills and track record develop. A beginner should start small and build confidence over time. An experienced trader with a proven edge can reasonably increase their risk per trade as their results justify it. But that confidence has to be earned through a track record, not assumed.
What Prop Firms Actually Look At
If you ever want to trade someone else's capital or attract outside funding, understanding R becomes even more critical. Prop trading firms do not care about your pip count or your percentage return in isolation. They look at your return relative to the risk you took to achieve it.
A prop trader only gets paid when their R value is above 1. Anything below 1 means they lost more than they made, regardless of how many pips they caught.
Banks, hedge funds, and prop firms all measure performance this way. They want to see that you are generating returns efficiently relative to the risk you are accepting. A long track record showing a consistent R value of 2 or 3 is far more impressive to a serious investor than a flashy percentage return achieved by risking too much on one trade.
One Important Warning
Understanding R does not mean you should start risking more per trade. That would completely miss the point. R is a measurement tool, not a license to increase your position size recklessly.
The goal is to keep your risk fixed and consistent so that your R value accurately reflects your trading edge over time.
If your risk changes from trade to trade, your R number becomes meaningless because you cannot compare the results fairly. Fix your risk, track your R, and let the results show you whether your strategy is actually working.
Final Thought
Stop chasing pip counts. Stop getting excited about percentage returns that look good on paper but mean very little in reality. Start measuring what actually matters, how much you make relative to how much you risk, consistently, over a large series of trades.
A trader with a 3R track record over 100 trades has proven something real. A trader with a 200% return on a $300 account has proven very little.
Track your R. Build your edge. Let the results speak for themselves.
Thank you for reading. I hope this article helped you better understand market behavior, trading psychology, and risk management during volatile conditions.
For more trading education, chart analysis, and market insights, follow:
Trade-Technique on TradingView
Most traders track their performance the wrong way. They obsess over pip counts, celebrate percentage returns, and compare account balances. None of that tells you whether you are actually trading well. Today I want to show you a better way to measure your results, one that professional traders and prop firms actually use.
This article is written for shorter-term traders who typically hold one to three positions at a time. If you manage a diversified stock portfolio or a hedge fund with dozens of assets, this may not apply directly to you. But if you are a retail trader managing your own account, read this carefully because it will change how you look at your performance.
Why Percentages and Pips Are Misleading
Here is the problem with measuring returns in percentages. A 100% return on a $500 account means you made $500. A 20% return on a $50,000 account means you made $10,000. Which trader performed better? The percentage says the first one. The reality says the second one.
Percentages look impressive on paper but they do not reflect the actual skill or risk involved in making those returns.
Pips have the same problem. A trader risking 50 pips to make 20 pips is performing very differently from a trader risking 10 pips to make 30 pips, even if both made the same number of pips in total. The pip count alone tells you nothing meaningful.
Every trader has a different account size, a different risk tolerance, and a different position sizing approach. Comparing performance using percentages or pips between two different traders is like comparing apples to oranges. It does not work.
The Right Way to Measure Performance: R
The most accurate and useful way to track your trading performance is through something called R, which stands for your risk to reward ratio across all your trades.
R is simply your total profits divided by your total losses over a series of trades.
If you made $100,000 in a year but lost $50,000, your R value is 2. That means for every dollar you lost, you made two dollars back. A 3R track record means you made three dollars for every dollar lost.
This number is what actually matters. It tells you whether your strategy is working, whether your risk management is sound, and whether you are making more than you are losing in a way that is sustainable over time.
Here is a real example using 20 trades with fixed risk:
Trade 01: +3R (Winner)
Trade 02: -1R (Loser)
Trade 03: -1R (Loser)
Trade 04: -1R (Loser)
Trade 05: +3R (Winner)
Trade 06: +3R (Winner)
Trade 07: -1R (Loser)
Trade 08: -1R (Loser)
Trade 09: +5R (Winner)
Trade 10: +4R (Winner)
Trade 11: +2R (Winner)
Trade 12: -1R (Loser)
Trade 13: -1R (Loser)
Trade 14: -1R (Loser)
Trade 15: +3R (Winner)
Trade 16: +6R (Winner)
Trade 17: -1R (Loser)
Trade 18: -1R (Loser)
Trade 19: -1R (Loser)
Trade 20: +4R (Winner)
Total Wins: 33R
Total Losses: 11R
Overall R: 3R (33 divided by 11 = 3)
Notice something important in that example. Out of 20 trades, 11 were losers and only 9 were winners. That means this trader lost on 55% of their trades and still came out with a 3R overall result. This is exactly why win rate alone means nothing. What matters is how much you make when you are right compared to how much you lose when you are wrong.
Account Size Does Not Tell the Full Story
Here is something most traders do not think about. Due to leverage, a trader with $1,000 in their account can trade a similar position size to a trader with $20,000 in their account. Account balance is not a reliable indicator of how much risk someone is taking or how skilled they are.
You do not need a large account balance to trade meaningful size. You need a clear understanding of your risk per trade.
For this reason, keeping all your trading capital in one account makes very little sense. Most of it can sit in a separate savings or investment account earning interest while you only keep what you need to trade your desired position size. The account balance your broker sees is not a reflection of your overall financial position or your trading ability.
Risk Tolerance Is Personal
One trader might be comfortable risking $200 per trade. Another might risk $2,000. Neither is right or wrong as long as it fits within their personal financial situation and does not affect their ability to make clear decisions.
A simple rule to check if you are risking too much: if your open trades are keeping you awake at night, your position size is too large.
Risk tolerance grows naturally as your skills and track record develop. A beginner should start small and build confidence over time. An experienced trader with a proven edge can reasonably increase their risk per trade as their results justify it. But that confidence has to be earned through a track record, not assumed.
What Prop Firms Actually Look At
If you ever want to trade someone else's capital or attract outside funding, understanding R becomes even more critical. Prop trading firms do not care about your pip count or your percentage return in isolation. They look at your return relative to the risk you took to achieve it.
A prop trader only gets paid when their R value is above 1. Anything below 1 means they lost more than they made, regardless of how many pips they caught.
Banks, hedge funds, and prop firms all measure performance this way. They want to see that you are generating returns efficiently relative to the risk you are accepting. A long track record showing a consistent R value of 2 or 3 is far more impressive to a serious investor than a flashy percentage return achieved by risking too much on one trade.
One Important Warning
Understanding R does not mean you should start risking more per trade. That would completely miss the point. R is a measurement tool, not a license to increase your position size recklessly.
The goal is to keep your risk fixed and consistent so that your R value accurately reflects your trading edge over time.
If your risk changes from trade to trade, your R number becomes meaningless because you cannot compare the results fairly. Fix your risk, track your R, and let the results show you whether your strategy is actually working.
Final Thought
Stop chasing pip counts. Stop getting excited about percentage returns that look good on paper but mean very little in reality. Start measuring what actually matters, how much you make relative to how much you risk, consistently, over a large series of trades.
A trader with a 3R track record over 100 trades has proven something real. A trader with a 200% return on a $300 account has proven very little.
Track your R. Build your edge. Let the results speak for themselves.
Thank you for reading. I hope this article helped you better understand market behavior, trading psychology, and risk management during volatile conditions.
For more trading education, chart analysis, and market insights, follow:
Trade-Technique on TradingView

관련 발행물
면책사항
해당 정보와 게시물은 금융, 투자, 트레이딩 또는 기타 유형의 조언이나 권장 사항으로 간주되지 않으며, 트레이딩뷰에서 제공하거나 보증하는 것이 아닙니다. 자세한 내용은 이용 약관을 참조하세요.
관련 발행물
면책사항
해당 정보와 게시물은 금융, 투자, 트레이딩 또는 기타 유형의 조언이나 권장 사항으로 간주되지 않으며, 트레이딩뷰에서 제공하거나 보증하는 것이 아닙니다. 자세한 내용은 이용 약관을 참조하세요.