
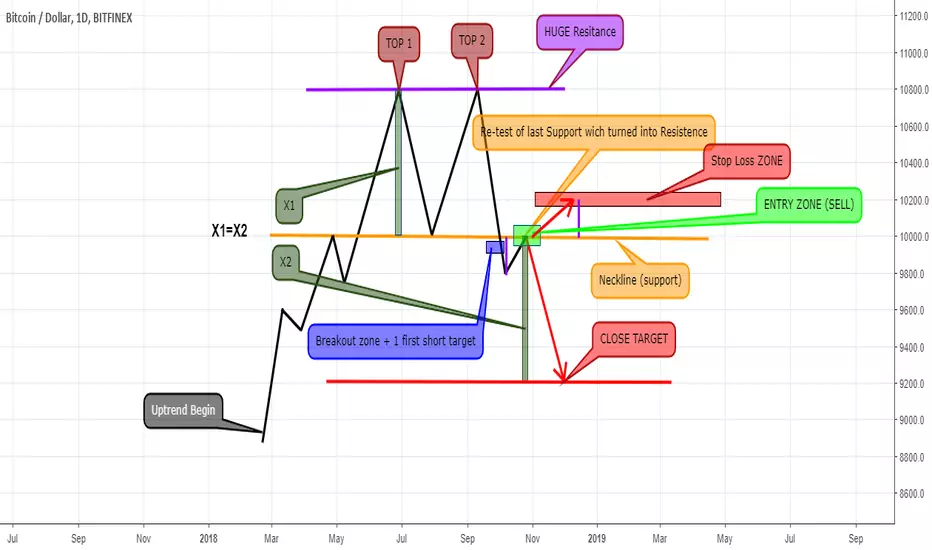
Double top is a reversal chart pattern which means the actually uptrend will be changed to bearish.In this chart pattern we see consecutive double price peaks
This patern occurs at the top of an massive uptrend.After reaching a high like 44-60 weeks high(for exemple) the price is moving to make another higher high but in this second peak bulls slowly will lost their confidence and also volume is still low
The bearish chart pattern is confirmed when the price breaks down below the low point of through
Often traders is started sell-off which will result into a huge red volume candle and also a short term coin-capitalization
Top of these peaks wll be turned into a huge long term resistance
This patern occurs at the top of an massive uptrend.After reaching a high like 44-60 weeks high(for exemple) the price is moving to make another higher high but in this second peak bulls slowly will lost their confidence and also volume is still low
The bearish chart pattern is confirmed when the price breaks down below the low point of through
Often traders is started sell-off which will result into a huge red volume candle and also a short term coin-capitalization
Top of these peaks wll be turned into a huge long term resistance

면책사항
해당 정보와 게시물은 금융, 투자, 트레이딩 또는 기타 유형의 조언이나 권장 사항으로 간주되지 않으며, 트레이딩뷰에서 제공하거나 보증하는 것이 아닙니다. 자세한 내용은 이용 약관을 참조하세요.
면책사항
해당 정보와 게시물은 금융, 투자, 트레이딩 또는 기타 유형의 조언이나 권장 사항으로 간주되지 않으며, 트레이딩뷰에서 제공하거나 보증하는 것이 아닙니다. 자세한 내용은 이용 약관을 참조하세요.