
BTC/USD — Long-Term Technical Analysis 📊
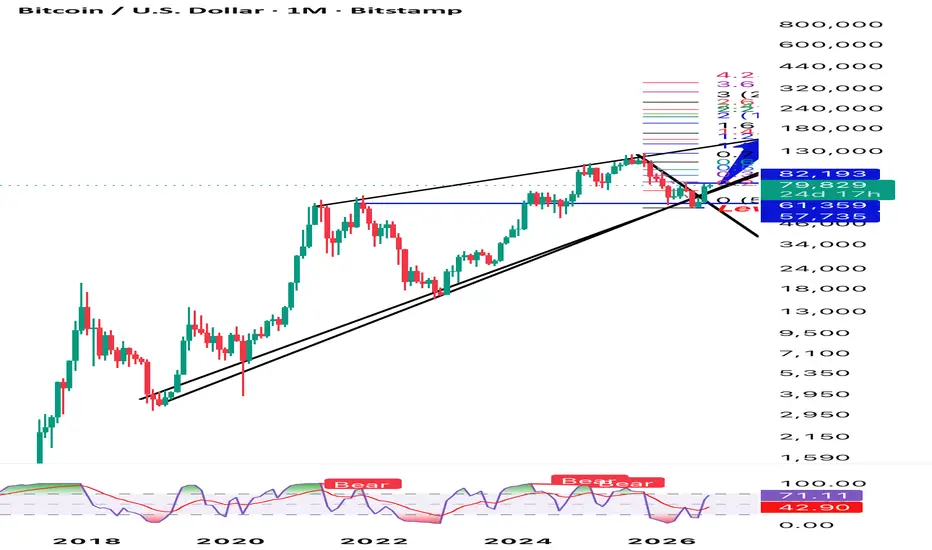
Bitcoin is currently trading around $79.8K, with price approaching a major resistance and breakout zone around $82.2K.
The monthly chart shows a long-term bullish structure supported by the rising trendline from previous major cycle lows. After the recent correction, BTC has bounced from the $57.7K–$61.4K support zone and is now testing the upper resistance area.
🔑 Key Levels
Resistance / Breakout
* $82.2K — key resistance and breakout level
* A monthly close above $82.2K would provide stronger confirmation of continuation.
* Holding above the breakout zone on a retest would strengthen the bullish setup.
Support / Risk
* $61.4K — major horizontal support
* $57.7K — critical support / invalidation area
* A sustained break below $57.7K would significantly weaken the bullish structure and invalidate this upside setup.
🎯 Fibonacci Upside Targets
If BTC confirms the breakout and maintains the long-term structure, the Fibonacci extensions on the chart give progressively higher objectives:
* $100K+ — psychological and initial upside objective
* $120K–$140K — major Fibonacci extension zone
* $160K–$180K — next extension area
* $200K+ — major long-term Fibonacci target
* $280K–$400K — extended Fibonacci targets for a strong long-term continuation
🛑 Stop-Loss / Invalidation
For a breakout setup, risk should be managed around the major support structure. A monthly loss of $57.7K would be the key technical invalidation level for this bullish thesis.
The preferred scenario is:
$82.2K breakout → successful retest → continuation toward $100K → $120K–$140K → $160K–$180K → $200K+ Fibonacci extensions.
The alternative scenario is rejection at $82.2K followed by a loss of $61.4K, which could bring the $57.7K support into focus.
This analysis is based on the chart’s long-term structure and Fibonacci extensions. These are technical levels, not guaranteed price targets or financial advice.
Bitcoin is currently trading around $79.8K, with price approaching a major resistance and breakout zone around $82.2K.
The monthly chart shows a long-term bullish structure supported by the rising trendline from previous major cycle lows. After the recent correction, BTC has bounced from the $57.7K–$61.4K support zone and is now testing the upper resistance area.
🔑 Key Levels
Resistance / Breakout
* $82.2K — key resistance and breakout level
* A monthly close above $82.2K would provide stronger confirmation of continuation.
* Holding above the breakout zone on a retest would strengthen the bullish setup.
Support / Risk
* $61.4K — major horizontal support
* $57.7K — critical support / invalidation area
* A sustained break below $57.7K would significantly weaken the bullish structure and invalidate this upside setup.
🎯 Fibonacci Upside Targets
If BTC confirms the breakout and maintains the long-term structure, the Fibonacci extensions on the chart give progressively higher objectives:
* $100K+ — psychological and initial upside objective
* $120K–$140K — major Fibonacci extension zone
* $160K–$180K — next extension area
* $200K+ — major long-term Fibonacci target
* $280K–$400K — extended Fibonacci targets for a strong long-term continuation
🛑 Stop-Loss / Invalidation
For a breakout setup, risk should be managed around the major support structure. A monthly loss of $57.7K would be the key technical invalidation level for this bullish thesis.
The preferred scenario is:
$82.2K breakout → successful retest → continuation toward $100K → $120K–$140K → $160K–$180K → $200K+ Fibonacci extensions.
The alternative scenario is rejection at $82.2K followed by a loss of $61.4K, which could bring the $57.7K support into focus.
This analysis is based on the chart’s long-term structure and Fibonacci extensions. These are technical levels, not guaranteed price targets or financial advice.

면책사항
해당 정보와 게시물은 금융, 투자, 트레이딩 또는 기타 유형의 조언이나 권장 사항으로 간주되지 않으며, 트레이딩뷰에서 제공하거나 보증하는 것이 아닙니다. 자세한 내용은 이용 약관을 참조하세요.
면책사항
해당 정보와 게시물은 금융, 투자, 트레이딩 또는 기타 유형의 조언이나 권장 사항으로 간주되지 않으며, 트레이딩뷰에서 제공하거나 보증하는 것이 아닙니다. 자세한 내용은 이용 약관을 참조하세요.