
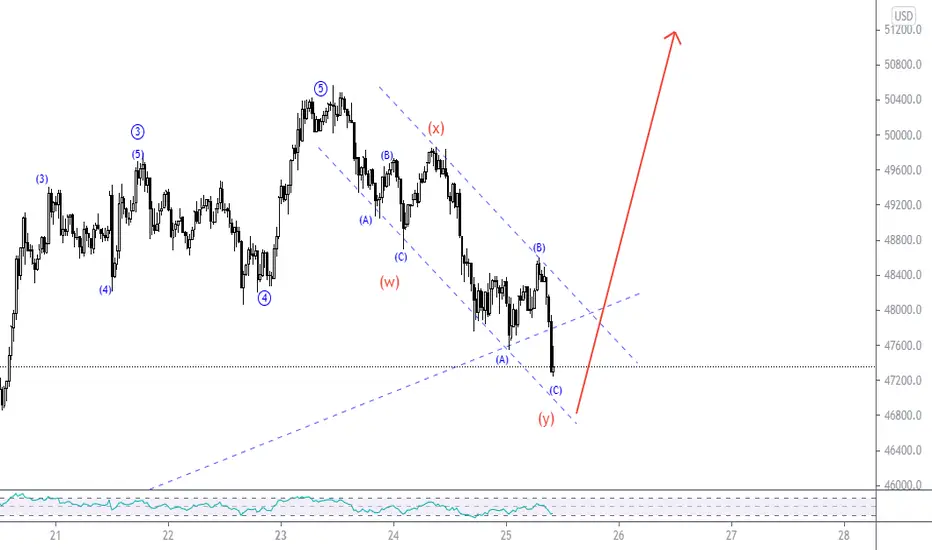
My analysis on btcUsd 30-minute chart Shows a potential corrective structure since we recognize an A-B-C structure that forms the first leg of double zig zag correction wave(w) and another A-B-C structure that makes up the last leg of the double combo.
Also, there is a descending parallel channel supporting the corrective strucre, I expect the corrective wave should terminate any time soon and then wait for a bullish confirmation signal to prepare for the next bullish move.
Also, there is a descending parallel channel supporting the corrective strucre, I expect the corrective wave should terminate any time soon and then wait for a bullish confirmation signal to prepare for the next bullish move.

면책사항
해당 정보와 게시물은 금융, 투자, 트레이딩 또는 기타 유형의 조언이나 권장 사항으로 간주되지 않으며, 트레이딩뷰에서 제공하거나 보증하는 것이 아닙니다. 자세한 내용은 이용 약관을 참조하세요.
면책사항
해당 정보와 게시물은 금융, 투자, 트레이딩 또는 기타 유형의 조언이나 권장 사항으로 간주되지 않으며, 트레이딩뷰에서 제공하거나 보증하는 것이 아닙니다. 자세한 내용은 이용 약관을 참조하세요.