
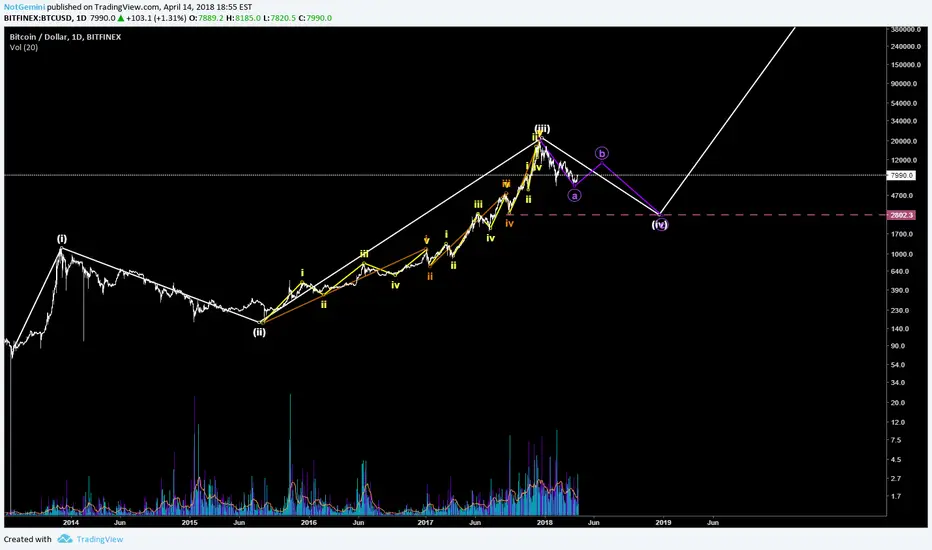
For waves that occur over long periods of time looking at a normal arithmetic price scale lacks the ability to normalize exponential growth. Under these circumstances, by looking at the logarithmic scale we see a different perspective on how price has been moving. This also makes it easier to plot waves.
___________________________________________________
Here's the analysis
on the largest scale, it seems to me that BTC just completed wave 3, which makes sense the growth was ridiculous during this wave
By that same token, our current correction seems relatively small in relation to the entire graph which still makes me believe that wave 4 is not yet completed
Finally, this also means that we will be beginning wave 5 upon completing our correction and ideally we should see another hefty move up
____________________________________________________
*Warning*
IF this is right then when we finish this next wave we will have completed an entire 5 wave cycle and it would be followed by a massive correction
노트
Wave 5 has a steeper slope than wave 3, Ignore that i didnt plot an actual projection for 5 its was just to show that we have another move up incoming노트
노트
Here is a retracement of A, this allows us to get a good idea of what we are expecting for B, the .382 tends to be the most common so that is where I am labeling B. 
면책사항
해당 정보와 게시물은 금융, 투자, 트레이딩 또는 기타 유형의 조언이나 권장 사항으로 간주되지 않으며, 트레이딩뷰에서 제공하거나 보증하는 것이 아닙니다. 자세한 내용은 이용 약관을 참조하세요.
면책사항
해당 정보와 게시물은 금융, 투자, 트레이딩 또는 기타 유형의 조언이나 권장 사항으로 간주되지 않으며, 트레이딩뷰에서 제공하거나 보증하는 것이 아닙니다. 자세한 내용은 이용 약관을 참조하세요.