
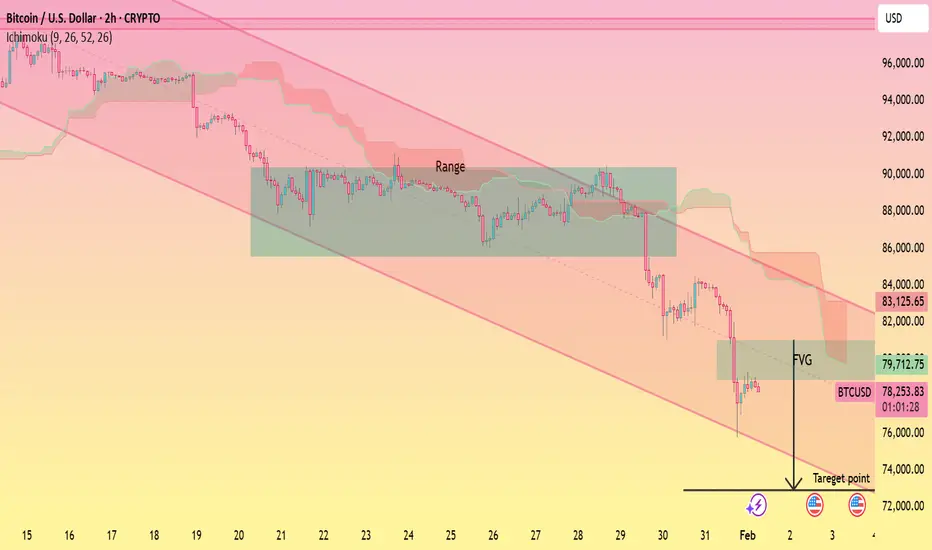
This is a 2-hour BTC/USD chart showing a clear **downtrend within a descending channel**. Price previously **ranged sideways** (marked “Range”), then **broke down sharply**, losing range support. The **Ichimoku cloud is bearish**, acting as resistance above price. After the breakdown, price formed a **bearish Fair Value Gap (FVG)** overhead and is consolidating below it. The chart highlights a **projected downside move toward the ~72,000 area**, aligning with the lower channel support as the target zone.
액티브 트레이드
active active 노트
my given target has been almost hit wait to complete target 거래청산: 타겟 닿음
my target has been achieved 
관련 발행물
면책사항
해당 정보와 게시물은 금융, 투자, 트레이딩 또는 기타 유형의 조언이나 권장 사항으로 간주되지 않으며, 트레이딩뷰에서 제공하거나 보증하는 것이 아닙니다. 자세한 내용은 이용 약관을 참조하세요.
관련 발행물
면책사항
해당 정보와 게시물은 금융, 투자, 트레이딩 또는 기타 유형의 조언이나 권장 사항으로 간주되지 않으며, 트레이딩뷰에서 제공하거나 보증하는 것이 아닙니다. 자세한 내용은 이용 약관을 참조하세요.