
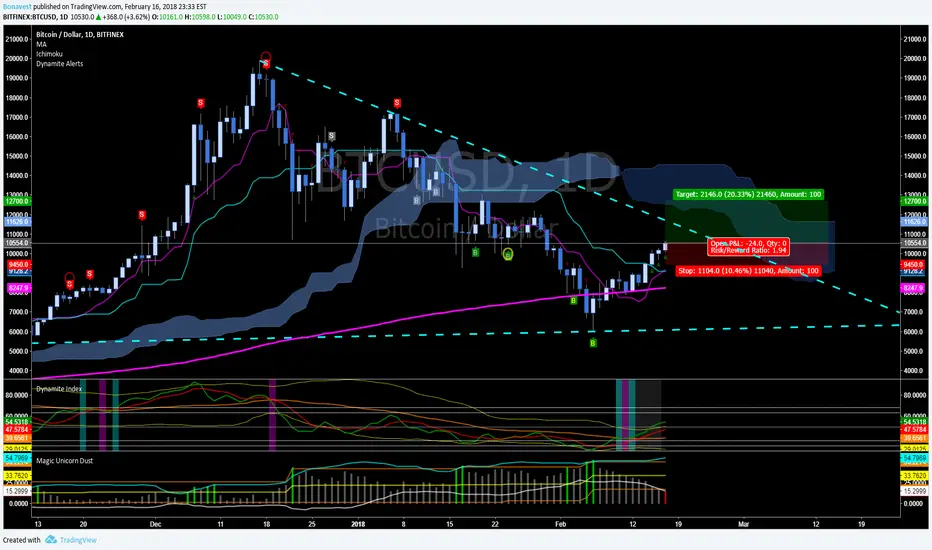
I am not saying the bottom is in, but this is the bounce I had been waiting for and pulled a good run up so far with my previous idea (linked below). The next extension does have one resistance point at the ATH Trend line (cyan dashed line) which has held up once before. If we have enough momentum to continue past that even with a small pull back we should be able to dig into the Ichimoku Cloud and us it as resistance.
I have brought back an old school indicator I used long ago with Bitcoin... The ol' Magic Unicorn Dust. this is actually a tried and true indicator... the Vix indicator. I just jazzed it up a bit and made some adjustments to be able to signal some possible SELL areas. More importantly the white and blue band lines help identify when to BUY in after drops in price have concluded.
Feel free to check out my Bitcoin 2018 Q1 chart which follows along with what this chart is looking to accomplish.
I have brought back an old school indicator I used long ago with Bitcoin... The ol' Magic Unicorn Dust. this is actually a tried and true indicator... the Vix indicator. I just jazzed it up a bit and made some adjustments to be able to signal some possible SELL areas. More importantly the white and blue band lines help identify when to BUY in after drops in price have concluded.
Feel free to check out my Bitcoin 2018 Q1 chart which follows along with what this chart is looking to accomplish.
노트
Magic Unicorn Dust says to GO LONG... plenty of room to move up to the next resistance at $11,300 > 매매 수동청산
So I just happened to be staring at the charts and started to see the 15m getting a bunch of SELL signals, closed out my LONG position and later entered a SHORT. Chart to follow for this relatively short SHORT.
관련 발행물
면책사항
해당 정보와 게시물은 금융, 투자, 트레이딩 또는 기타 유형의 조언이나 권장 사항으로 간주되지 않으며, 트레이딩뷰에서 제공하거나 보증하는 것이 아닙니다. 자세한 내용은 이용 약관을 참조하세요.
면책사항
해당 정보와 게시물은 금융, 투자, 트레이딩 또는 기타 유형의 조언이나 권장 사항으로 간주되지 않으며, 트레이딩뷰에서 제공하거나 보증하는 것이 아닙니다. 자세한 내용은 이용 약관을 참조하세요.