
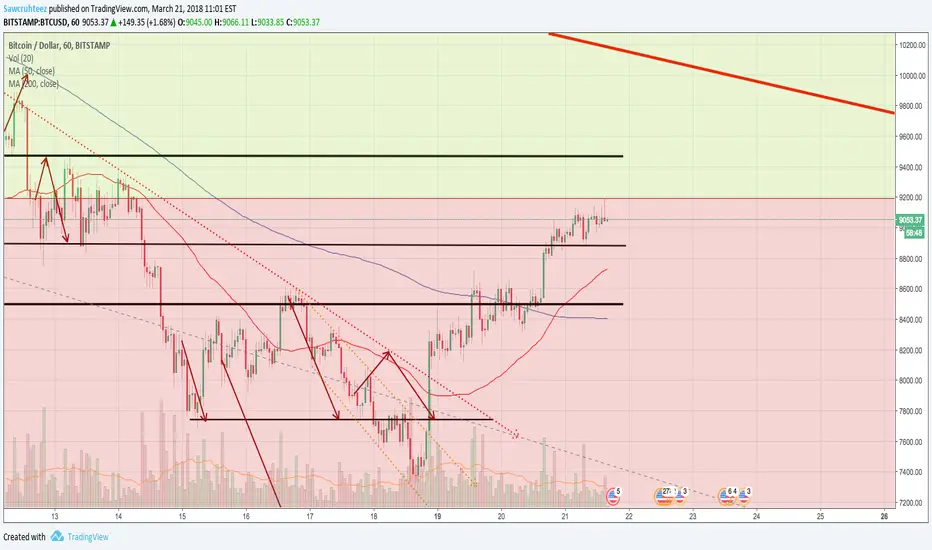
Yesterday I mentioned $9,200 as an important area of resistance due to the 0.236 FIB retracement. The bulls made a strong push with market buys but were unable to break through that level.
Now we have a shooting star that should cause us to turn back and retest $8,800. If that holds then I would be optimistic about breaking through $9,200 on the next rally. If that doesn’t hold then I will be looking out below.
I am still staying away and recommend others do as well. I will be closely watching the areas below for further confirmation before re entering.
(1) 0.236 Fib resistance at $9,200.
(2) Linear bear trend anywhere from $9,500 - $10,000
(3) Death cross on 50/200 day SMA (1 day chart) - Expect this to be approaching in the next 2-3 days.
Happy trading and like/comment/follow!
Now we have a shooting star that should cause us to turn back and retest $8,800. If that holds then I would be optimistic about breaking through $9,200 on the next rally. If that doesn’t hold then I will be looking out below.
I am still staying away and recommend others do as well. I will be closely watching the areas below for further confirmation before re entering.
(1) 0.236 Fib resistance at $9,200.
(2) Linear bear trend anywhere from $9,500 - $10,000
(3) Death cross on 50/200 day SMA (1 day chart) - Expect this to be approaching in the next 2-3 days.
Happy trading and like/comment/follow!

emasar Indicator is available for purchase at alphanalysis.io/product/emasar/
면책사항
해당 정보와 게시물은 금융, 투자, 트레이딩 또는 기타 유형의 조언이나 권장 사항으로 간주되지 않으며, 트레이딩뷰에서 제공하거나 보증하는 것이 아닙니다. 자세한 내용은 이용 약관을 참조하세요.
emasar Indicator is available for purchase at alphanalysis.io/product/emasar/
면책사항
해당 정보와 게시물은 금융, 투자, 트레이딩 또는 기타 유형의 조언이나 권장 사항으로 간주되지 않으며, 트레이딩뷰에서 제공하거나 보증하는 것이 아닙니다. 자세한 내용은 이용 약관을 참조하세요.