
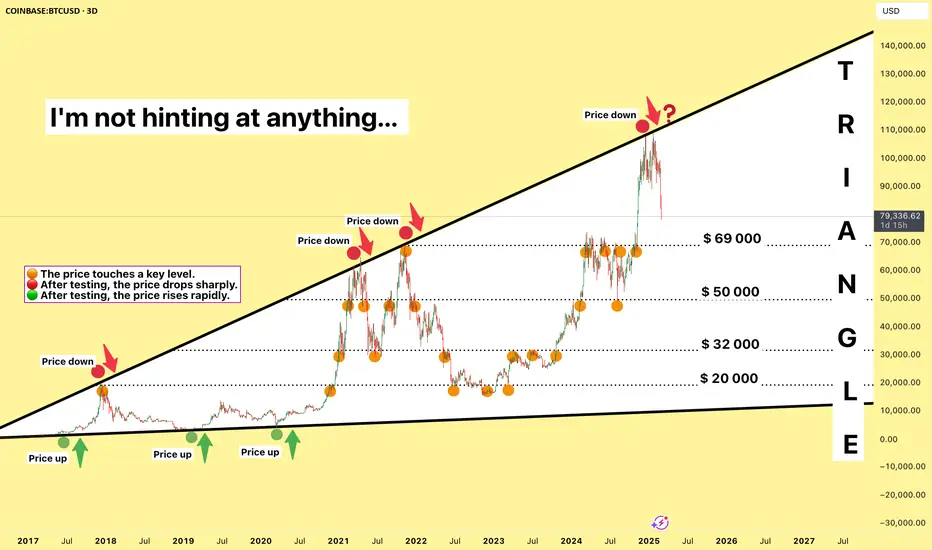
Hey, traders! 👋 Bitcoin is currently forming an inverted triangle, a pattern that often signals strong volatility ahead. Take a close look at the chart—I've marked key moments with different colored circles:
🟠 The price touches a key level.
🔴 After testing, the price drops sharply.
🟢 After testing, the price rises rapidly.
The levels are clearly visible on the chart, but what happens next? That’s the big question!
I’m not hinting at anything—this chart is open for interpretation. Everyone sees what they want to see, or maybe it helps deepen your own analysis.
So, what do YOU see? Where is Bitcoin headed next? Let’s discuss in the comments!
Thanks for Your attention🫶
Sincerely Yours, Kateryna 💛
🟠 The price touches a key level.
🔴 After testing, the price drops sharply.
🟢 After testing, the price rises rapidly.
The levels are clearly visible on the chart, but what happens next? That’s the big question!
I’m not hinting at anything—this chart is open for interpretation. Everyone sees what they want to see, or maybe it helps deepen your own analysis.
So, what do YOU see? Where is Bitcoin headed next? Let’s discuss in the comments!
Thanks for Your attention🫶
Sincerely Yours, Kateryna 💛
액티브 트레이드
The MACD indicator is usually very informative on the weekly chart.

관련 발행물
면책사항
해당 정보와 게시물은 금융, 투자, 트레이딩 또는 기타 유형의 조언이나 권장 사항으로 간주되지 않으며, 트레이딩뷰에서 제공하거나 보증하는 것이 아닙니다. 자세한 내용은 이용 약관을 참조하세요.
면책사항
해당 정보와 게시물은 금융, 투자, 트레이딩 또는 기타 유형의 조언이나 권장 사항으로 간주되지 않으며, 트레이딩뷰에서 제공하거나 보증하는 것이 아닙니다. 자세한 내용은 이용 약관을 참조하세요.