
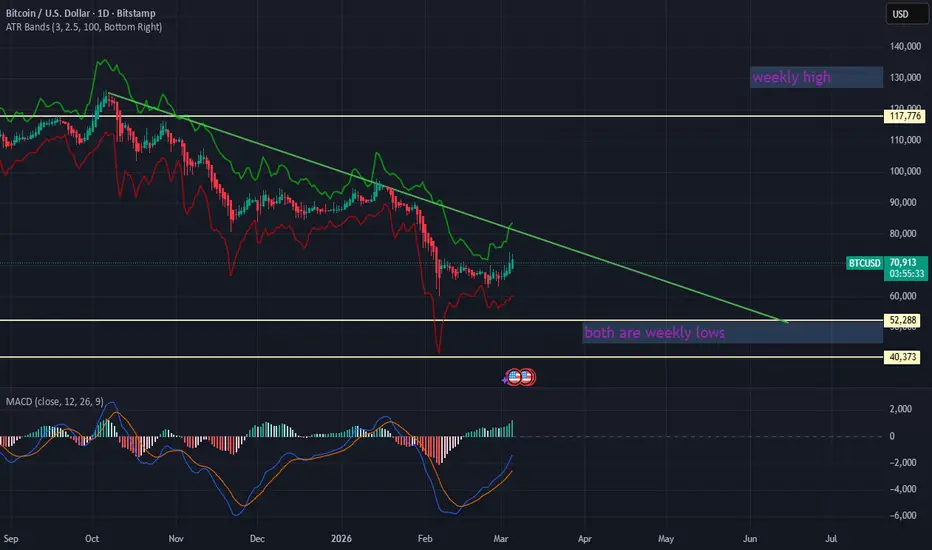
created 3/5/26
weekly/1d timeframes, are in a low momentum area may see false bullish breakouts due to 1D timeframe recently creating lower lows and macd momentum being bearish headed towards the 50/50 area which which could turn the tide for the weekly chart but that is out of the picture for now until a real confirmation comes along
weekly/1d timeframes, are in a low momentum area may see false bullish breakouts due to 1D timeframe recently creating lower lows and macd momentum being bearish headed towards the 50/50 area which which could turn the tide for the weekly chart but that is out of the picture for now until a real confirmation comes along
액티브 트레이드
longterm charts W/1D macd momentum is bearish, seems like market wants to take a break from the bearish momentum, shorter time frame 1H/15M chart confirm slow momentum as bears try to push to bulls side, 4H momentum is just below 50/50 median may can expect sustainment to bulls side due to condition of prehistoric data and candle sustainment conditions. shorter time frames contradict bullish sustainment idea due to low bullish momentum.거래청산: 타겟 닿음
longterm charts MACD express momentum divergence while volatility may be bullish candle sustainment suggests a pullback (bearish) may be necessary don't expect major price swings except for the bullish volatility.노트
SPX confirms the bullish momentum of dxy due to dying momentum and candle instability on short timeframes 노트
Bitcoin looks to continue its decline market looks like its stalling though, expect more selling 1d low 60,508.노트
Market is in a neutral state currently experiencing stagflation, longer timeframes 1m/1w indicate a little more droppage to come and shorter time frame contradicts that theory due to simply beig out of gas which is where stagflation steps in. most red momentum is fading into bulls attempting to push market up but nptice bulls successful in pushing market down after inability to push market upward. May take a retest or 2 to get started in the bulls zone.
관련 발행물
면책사항
해당 정보와 게시물은 금융, 투자, 트레이딩 또는 기타 유형의 조언이나 권장 사항으로 간주되지 않으며, 트레이딩뷰에서 제공하거나 보증하는 것이 아닙니다. 자세한 내용은 이용 약관을 참조하세요.
면책사항
해당 정보와 게시물은 금융, 투자, 트레이딩 또는 기타 유형의 조언이나 권장 사항으로 간주되지 않으며, 트레이딩뷰에서 제공하거나 보증하는 것이 아닙니다. 자세한 내용은 이용 약관을 참조하세요.