
Hello, welcome to this BITCOIN /USD update by CRYPTO SANDERS.
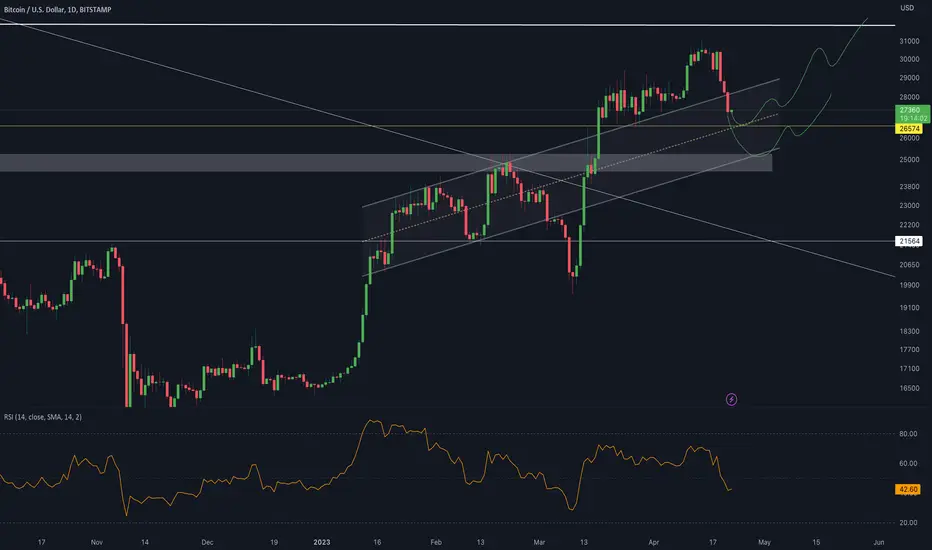
CHART ANALYSIS:- Bitcoin (BTC) moved lower for a third consecutive session on Friday, as prices slipped below the 28,000 mark.
Following a high of 28,906.25 on Thursday, BTC/USD dropped to an intraday low of 27,855.96 earlier in the day.
As a result of this move, bitcoin fell to its weakest point since April 9, which was the last time price hit a floor of 27,800.
Since nearing this point, BTC bulls have reentered the market, and have pushed prices back above 28,000.
One of the catalysts for today’s drop came as the 14-day relative strength index (RSI) fell to a floor of its own at 46.00.
The index has marginally risen from this low and is tracking at 46.35 when writing.
I have tried to bring the best possible outcome to this chart.
Hit the like button if you like it and share your charts in the comments section.
Thank you.
CHART ANALYSIS:- Bitcoin (BTC) moved lower for a third consecutive session on Friday, as prices slipped below the 28,000 mark.
Following a high of 28,906.25 on Thursday, BTC/USD dropped to an intraday low of 27,855.96 earlier in the day.
As a result of this move, bitcoin fell to its weakest point since April 9, which was the last time price hit a floor of 27,800.
Since nearing this point, BTC bulls have reentered the market, and have pushed prices back above 28,000.
One of the catalysts for today’s drop came as the 14-day relative strength index (RSI) fell to a floor of its own at 46.00.
The index has marginally risen from this low and is tracking at 46.35 when writing.
I have tried to bring the best possible outcome to this chart.
Hit the like button if you like it and share your charts in the comments section.
Thank you.

관련 발행물
면책사항
해당 정보와 게시물은 금융, 투자, 트레이딩 또는 기타 유형의 조언이나 권장 사항으로 간주되지 않으며, 트레이딩뷰에서 제공하거나 보증하는 것이 아닙니다. 자세한 내용은 이용 약관을 참조하세요.
관련 발행물
면책사항
해당 정보와 게시물은 금융, 투자, 트레이딩 또는 기타 유형의 조언이나 권장 사항으로 간주되지 않으며, 트레이딩뷰에서 제공하거나 보증하는 것이 아닙니다. 자세한 내용은 이용 약관을 참조하세요.