
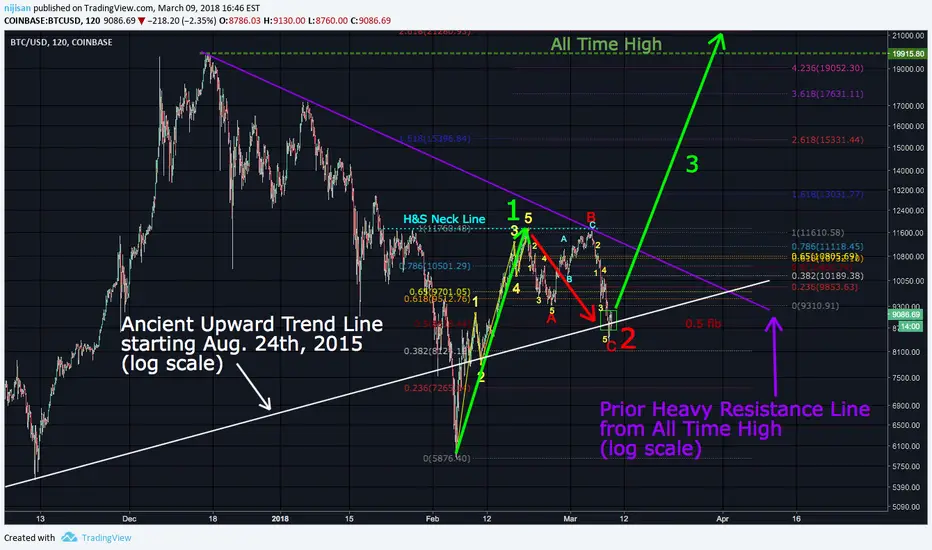
This is really interesting to me. Trend lines change position depending on whether you are in log or linear scale.
The trend line from the All Time High hits in a different place then the linear version.
Anyway, I picked a spot (a dip) right about Aug 24th, 2015 as a starting point for that white trend line.
Even though it wanders sometimes above and sometimes below the ever rising wave trends,
the amount of direct hits in support and resistance are too numerous to discount.
And here it is, running right thru my Wave 2 ABC target box... (still holding around my $8,800 target!).
The next interesting thing is it's forthcoming intersection with the log scale purple trend line down from the All Time High.
Make of it what you will. I'm not completely sure how to analyze it's potential... but I DO find it fascinating!
Any thoughts?
Best of luck traders! Wishing you all the best in 2018.
The trend line from the All Time High hits in a different place then the linear version.
Anyway, I picked a spot (a dip) right about Aug 24th, 2015 as a starting point for that white trend line.
Even though it wanders sometimes above and sometimes below the ever rising wave trends,
the amount of direct hits in support and resistance are too numerous to discount.
And here it is, running right thru my Wave 2 ABC target box... (still holding around my $8,800 target!).
The next interesting thing is it's forthcoming intersection with the log scale purple trend line down from the All Time High.
Make of it what you will. I'm not completely sure how to analyze it's potential... but I DO find it fascinating!
Any thoughts?
Best of luck traders! Wishing you all the best in 2018.

면책사항
해당 정보와 게시물은 금융, 투자, 트레이딩 또는 기타 유형의 조언이나 권장 사항으로 간주되지 않으며, 트레이딩뷰에서 제공하거나 보증하는 것이 아닙니다. 자세한 내용은 이용 약관을 참조하세요.
면책사항
해당 정보와 게시물은 금융, 투자, 트레이딩 또는 기타 유형의 조언이나 권장 사항으로 간주되지 않으며, 트레이딩뷰에서 제공하거나 보증하는 것이 아닙니다. 자세한 내용은 이용 약관을 참조하세요.