
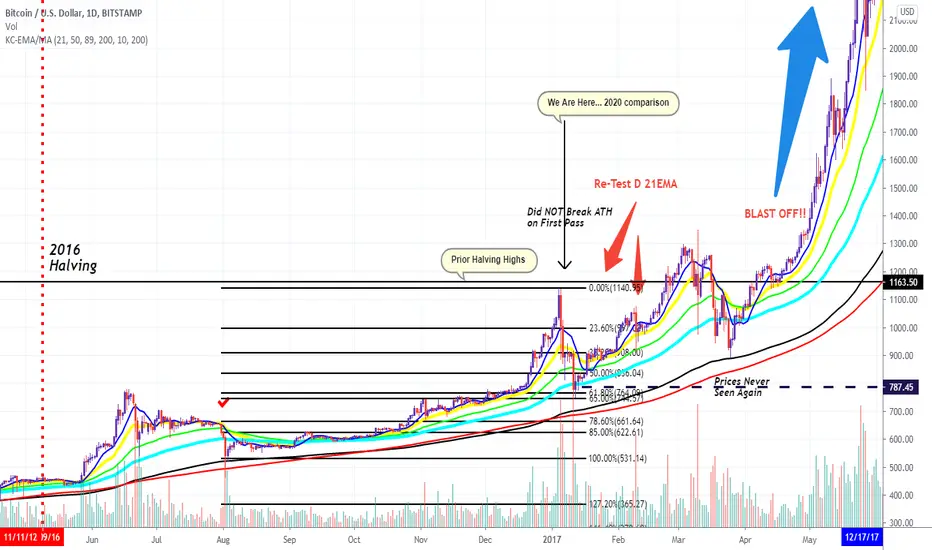
Retro Chart I've been posting and its hitting similarities in 2020. Just hit the Daily 21 EMA, might test the Daily 89 EMA...didn't test Weekly 21 EMA unitl January 2017, but by then...the Dip to the 21 Daily EMA was still Lower than the Januaru Dip...Prices Never Seen Again...
노트
Thanks for all the Likes and comments, follow my feed and we'll refer to this chart for the next year adding to it and compare the past and current Bull Runs
면책사항
해당 정보와 게시물은 금융, 투자, 트레이딩 또는 기타 유형의 조언이나 권장 사항으로 간주되지 않으며, 트레이딩뷰에서 제공하거나 보증하는 것이 아닙니다. 자세한 내용은 이용 약관을 참조하세요.
면책사항
해당 정보와 게시물은 금융, 투자, 트레이딩 또는 기타 유형의 조언이나 권장 사항으로 간주되지 않으며, 트레이딩뷰에서 제공하거나 보증하는 것이 아닙니다. 자세한 내용은 이용 약관을 참조하세요.