
It's great to be back posting regularly, today I'll be analysing the similarities in market cycles for bitcoin.
For reference we have two charts we are going to be focusing on (use the two for comparison).
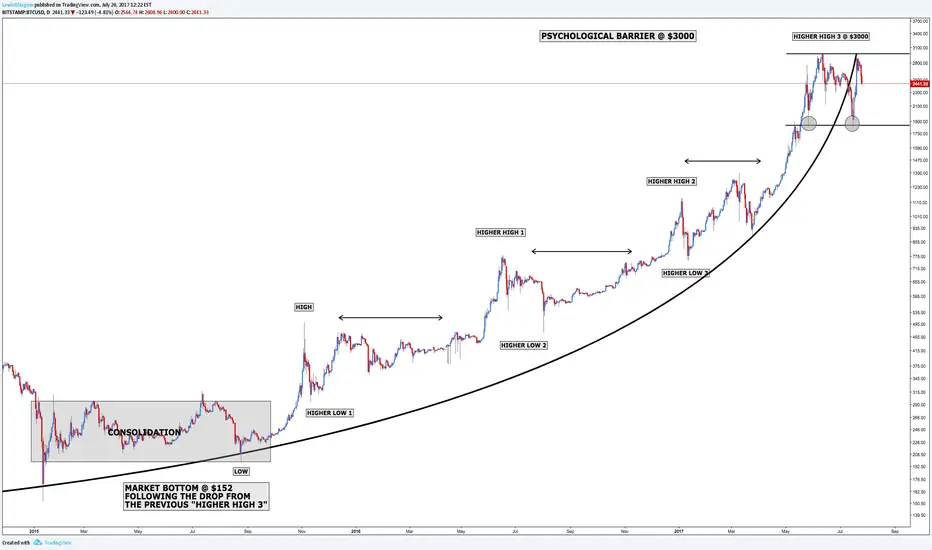
Chart #1: 2011-2014 (all time high $1160)

Chart #2: 2015-2017 (all time high $3000)

The analysis displayed in front of you is similar to my Siacoin prediction which was extremely successful (chart is shown below).
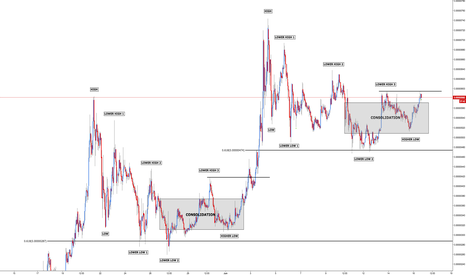
This is the reasoning behind the title "Rinse and Repeat x2".
Now back to the point, bitcoin... As you can see from charts #1 and #2 they both follow a similar cycle, although, years apart.
Many would call this structure a parabolic curve, however, I prefer the lows touching the curve.
Both moves start of from low to high and finish on higher high 3 at their all time high, from there a double test of support can be seen on both charts.
I'm expecting a move to support around $1800 as my first target, from there I will update my analysis.
With August 1st around the corner it will be interesting to see the future direction.
As always thank you for your support!
For reference we have two charts we are going to be focusing on (use the two for comparison).
Chart #1: 2011-2014 (all time high $1160)
Chart #2: 2015-2017 (all time high $3000)
The analysis displayed in front of you is similar to my Siacoin prediction which was extremely successful (chart is shown below).
This is the reasoning behind the title "Rinse and Repeat x2".
Now back to the point, bitcoin... As you can see from charts #1 and #2 they both follow a similar cycle, although, years apart.
Many would call this structure a parabolic curve, however, I prefer the lows touching the curve.
Both moves start of from low to high and finish on higher high 3 at their all time high, from there a double test of support can be seen on both charts.
I'm expecting a move to support around $1800 as my first target, from there I will update my analysis.
With August 1st around the corner it will be interesting to see the future direction.
As always thank you for your support!

📈 Master the Art and Science of Trading: sixfigurecapital.com
관련 발행물
면책사항
해당 정보와 게시물은 금융, 투자, 트레이딩 또는 기타 유형의 조언이나 권장 사항으로 간주되지 않으며, 트레이딩뷰에서 제공하거나 보증하는 것이 아닙니다. 자세한 내용은 이용 약관을 참조하세요.
📈 Master the Art and Science of Trading: sixfigurecapital.com
관련 발행물
면책사항
해당 정보와 게시물은 금융, 투자, 트레이딩 또는 기타 유형의 조언이나 권장 사항으로 간주되지 않으며, 트레이딩뷰에서 제공하거나 보증하는 것이 아닙니다. 자세한 내용은 이용 약관을 참조하세요.