
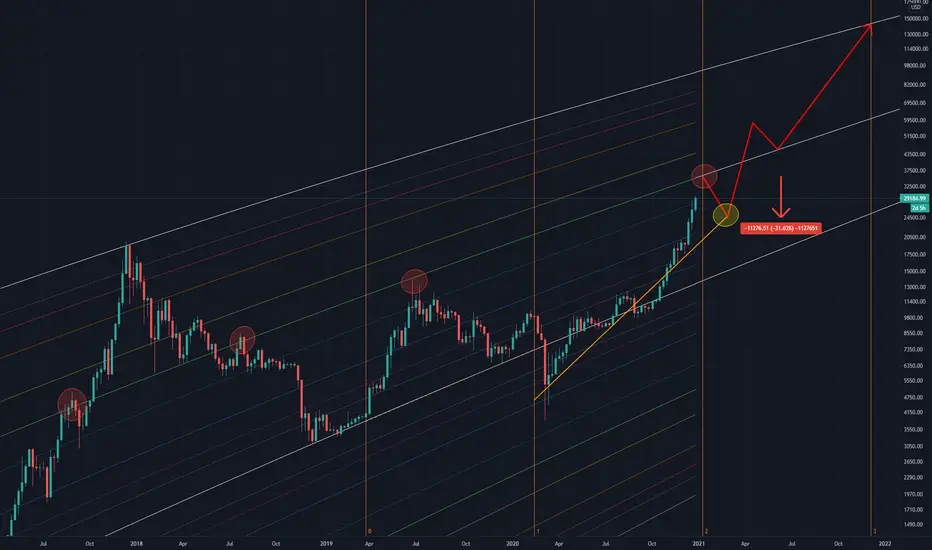
Every bitcoin bullrun so far has had pullbacks ,will history repeat itself, at this point we cant deny the fact the stock to flow model is still intact .
lookintobitcoin.com/charts/stock-to-flow-model/
So everything is setting up what looks to be the first pullback of this rally , as you can see we are coming up to very strong Fibonacci log band , this log band has a history of extreme resistance and volatility (Red circles ).
A pullback of 30% would bring the price down to about 24400 Dollars which would close the CME gap created that that price , all CME gaps get closed so at one point if you look back at the charts. (Yellow Circle)
The month of January is historical bitcoins worst preforming month.
lookintobitcoin.com/charts/stock-to-flow-model/
So everything is setting up what looks to be the first pullback of this rally , as you can see we are coming up to very strong Fibonacci log band , this log band has a history of extreme resistance and volatility (Red circles ).
A pullback of 30% would bring the price down to about 24400 Dollars which would close the CME gap created that that price , all CME gaps get closed so at one point if you look back at the charts. (Yellow Circle)
The month of January is historical bitcoins worst preforming month.

면책사항
해당 정보와 게시물은 금융, 투자, 트레이딩 또는 기타 유형의 조언이나 권장 사항으로 간주되지 않으며, 트레이딩뷰에서 제공하거나 보증하는 것이 아닙니다. 자세한 내용은 이용 약관을 참조하세요.
면책사항
해당 정보와 게시물은 금융, 투자, 트레이딩 또는 기타 유형의 조언이나 권장 사항으로 간주되지 않으며, 트레이딩뷰에서 제공하거나 보증하는 것이 아닙니다. 자세한 내용은 이용 약관을 참조하세요.