
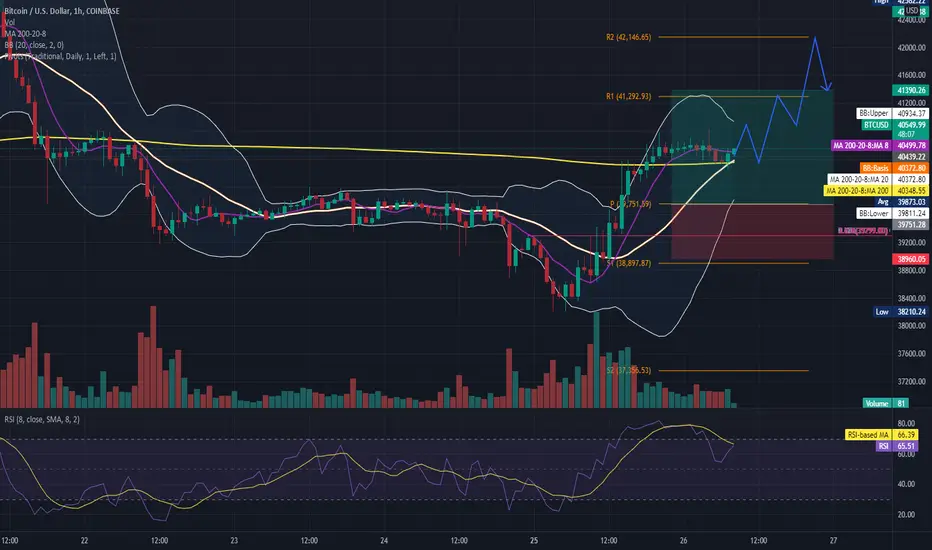
Hello traders, the price bouncing on the MA200, the price is over the pivot point, it might go up until R1 or R2. Pls, remember to check the trend. The prices could retrace until the inmediatly last band, bouncing, and then continue the trend. If the price breaks down the pivot point we will go in short. (downtrend)
Indicators MA 200, 20-8 RSI 8 MA8 Bolliger 20, Volume, Pivot points Levels. Intraday Strategy. 1-hour frame.
R3 44,541.71
R2 42,146.65
R1 41,292.93
PP 39,751.59
S1 38,897.87
S2 37,356.53
S3 34,961.47
Indicators MA 200, 20-8 RSI 8 MA8 Bolliger 20, Volume, Pivot points Levels. Intraday Strategy. 1-hour frame.
R3 44,541.71
R2 42,146.65
R1 41,292.93
PP 39,751.59
S1 38,897.87
S2 37,356.53
S3 34,961.47

면책사항
해당 정보와 게시물은 금융, 투자, 트레이딩 또는 기타 유형의 조언이나 권장 사항으로 간주되지 않으며, 트레이딩뷰에서 제공하거나 보증하는 것이 아닙니다. 자세한 내용은 이용 약관을 참조하세요.
면책사항
해당 정보와 게시물은 금융, 투자, 트레이딩 또는 기타 유형의 조언이나 권장 사항으로 간주되지 않으며, 트레이딩뷰에서 제공하거나 보증하는 것이 아닙니다. 자세한 내용은 이용 약관을 참조하세요.