
Hello Traders,
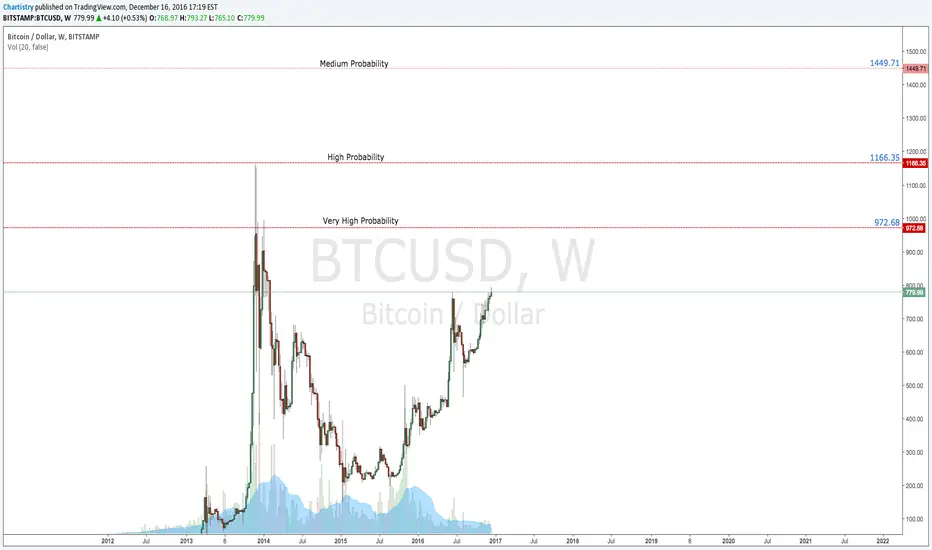
Putting Bitcoin to the test of the Forecasting model tells us that there is a high probability of a new all time highs being created in the near future.
For those that have not seen the model at work, take a look at the previous forecasts I have made in the related links below. It has proven to be quite a good tool to predict and forecast future price and reversal targets.
With that being said, Bitcoin does not escape the same dynamics that govern all financial markets, and thus, can be successfully predicted using the model I have used for the charts below.
The targets are defined as follows:
Dark Red = Very High Probability of attainment = Low Probability Reversal
Medium Red = High Probability of attainment = Medium Probability Reversal
Light Red = Medium Probability of attainment = High Probability Reversal
Stay tuned for further updates.
Chartistry
Putting Bitcoin to the test of the Forecasting model tells us that there is a high probability of a new all time highs being created in the near future.
For those that have not seen the model at work, take a look at the previous forecasts I have made in the related links below. It has proven to be quite a good tool to predict and forecast future price and reversal targets.
With that being said, Bitcoin does not escape the same dynamics that govern all financial markets, and thus, can be successfully predicted using the model I have used for the charts below.
The targets are defined as follows:
Dark Red = Very High Probability of attainment = Low Probability Reversal
Medium Red = High Probability of attainment = Medium Probability Reversal
Light Red = Medium Probability of attainment = High Probability Reversal
Stay tuned for further updates.
Chartistry
노트
UPDATE: Model has identified a hidden resistance level. However, this is not to say that the rally will stop short here. Rather, we will see a short moment of either a correction or consolidation at this level before price continues to move forward.I will update this pair as it moves along.
Best,
Chartistry
노트
Update: 1st Target hit dead on.노트
UPDATE: Bullish move NOT over yet. Prepare for one more leg up to hit 1166 as indicated on chart and beyond. All time highs still a very high possibility. More updates with charts to come in the next few days.Best,
Chartistry
노트
UPDATE: The High Probability Target has been hit. Still no sign of reversal. Expect the Medium Probability Target to have a significance in future price action.For those of you who have been in the buy position, congratulations and get ready to take profit soon.
Best.
Chartistry
노트
UPDATE: Can this be the end of the bull run? Forecasting model suggests so.
Chartistry
노트
UPDATE: WEEKLY time frame supersedes geometry development in the DAILY time frame. The WEEKLY time frame is now eyeing 1449.71 and with enough strength, 1559. 1559 remains a low probability target defined by the predictive/forecasting model. In the case price DOES continue to rise above 1559 I would look at the MONTHLY time frame for future price development. Chartistry
노트
1449.71 hit DEAD ON! 1599 still remains a probability.
노트
Target Hit DEAD ON!
관련 발행물
면책사항
해당 정보와 게시물은 금융, 투자, 트레이딩 또는 기타 유형의 조언이나 권장 사항으로 간주되지 않으며, 트레이딩뷰에서 제공하거나 보증하는 것이 아닙니다. 자세한 내용은 이용 약관을 참조하세요.
관련 발행물
면책사항
해당 정보와 게시물은 금융, 투자, 트레이딩 또는 기타 유형의 조언이나 권장 사항으로 간주되지 않으며, 트레이딩뷰에서 제공하거나 보증하는 것이 아닙니다. 자세한 내용은 이용 약관을 참조하세요.