
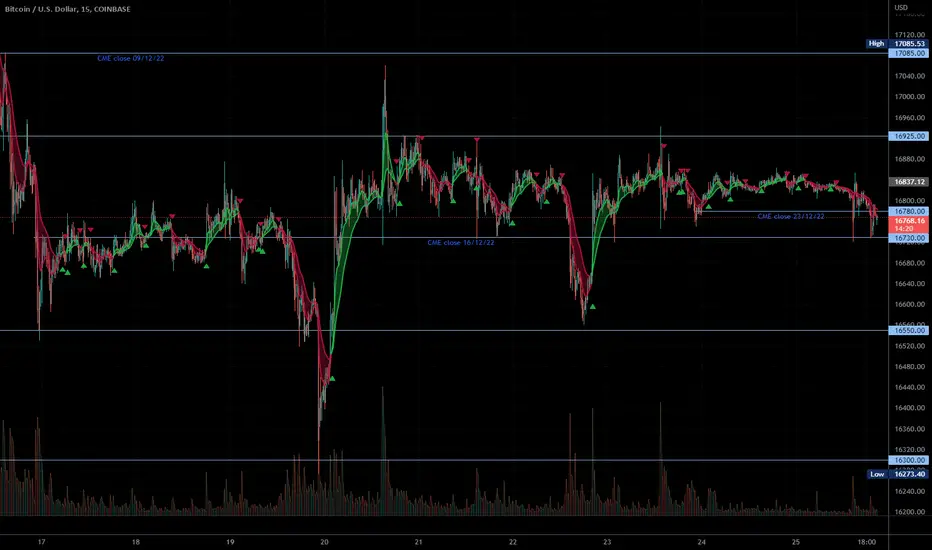
Not a great deal of excitement to be had from bitcoin lately. However here's a recurring pattern i have been observing lately since we've been stuck in so many tight ranges. Quite simply the horizontal lines here correspond to recent CME weekly close prices. The whole gap filling thing is well known so i won't go into that but what is more interesting is how many times these lines have provided minor supports and resistances when viewed in shorter time frames. Last week's close level has provided us 6 small bounces since tuesday, perhaps more if we zoom into even lower timeframes from last weekend. This is not an isolated case either.
Obviously this is mainly of interest for scalping while the market is so tightly bound but it's useful to note that some like the 18th and 25th Nov closes lower down have also given us so larger bounces.
To clarify the price i'm using is the actual weekly close from the CME futures regardless of any divergence it has from the spot price at that same time. Initially i was just looking at them for gap fill targets but it seems they continue to be useful even after that. Worth taking the time to explore this while the market is sideways. I expect this idea will become obsolete whenever btc starts to show signs of a trending direction, either up or down. Of course, we may be waiting some for that to happen.
노트
Now that bitcoin has broken out of the previous tight range, this idea may become redundant. However throughout last week, as bitcoin was consolidating around 21k, two older CME gaps (from the weekends just prior to FTX collapse) came into play. Most notably one at 20700 which acted as support multiple times.I shall keep this idea active for now and see whether it remains useful over the coming weeks.

면책사항
해당 정보와 게시물은 금융, 투자, 트레이딩 또는 기타 유형의 조언이나 권장 사항으로 간주되지 않으며, 트레이딩뷰에서 제공하거나 보증하는 것이 아닙니다. 자세한 내용은 이용 약관을 참조하세요.
면책사항
해당 정보와 게시물은 금융, 투자, 트레이딩 또는 기타 유형의 조언이나 권장 사항으로 간주되지 않으며, 트레이딩뷰에서 제공하거나 보증하는 것이 아닙니다. 자세한 내용은 이용 약관을 참조하세요.