
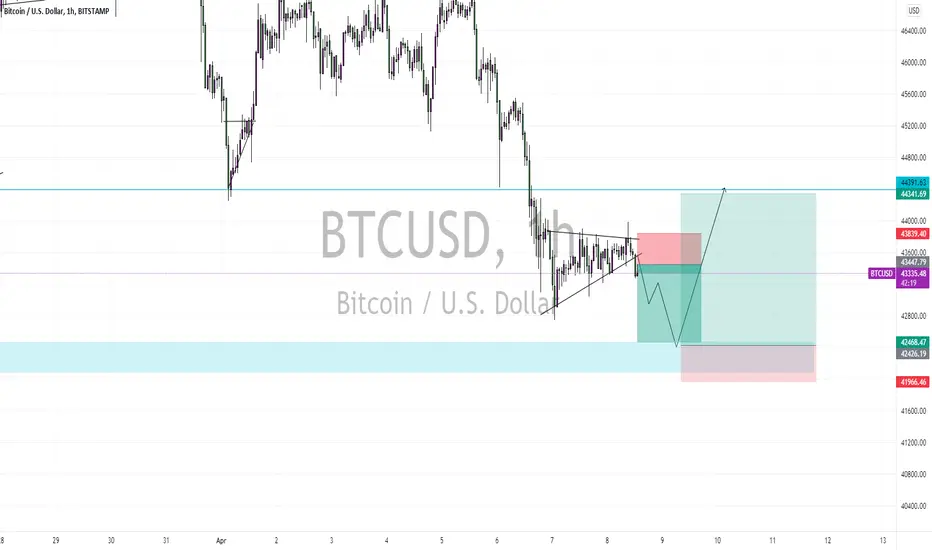
BTC Appears to have fully formed a rising wedge on the current downtrend in the 1hr timeframe, and from knowledge of chart patterns ad price action, it is obvious that a rising wedge on a downtrend is a trend continuation pattern.
This downtrend would be met with a previous zone of support at the 42,400 regions. This could lead to a bounce to the top side, following a trend to the topside before meeting resistance at a previous support level at 44,391. If this resistance fails to hold, we could witness higher highs.
This downtrend would be met with a previous zone of support at the 42,400 regions. This could lead to a bounce to the top side, following a trend to the topside before meeting resistance at a previous support level at 44,391. If this resistance fails to hold, we could witness higher highs.

면책사항
해당 정보와 게시물은 금융, 투자, 트레이딩 또는 기타 유형의 조언이나 권장 사항으로 간주되지 않으며, 트레이딩뷰에서 제공하거나 보증하는 것이 아닙니다. 자세한 내용은 이용 약관을 참조하세요.
면책사항
해당 정보와 게시물은 금융, 투자, 트레이딩 또는 기타 유형의 조언이나 권장 사항으로 간주되지 않으며, 트레이딩뷰에서 제공하거나 보증하는 것이 아닙니다. 자세한 내용은 이용 약관을 참조하세요.