
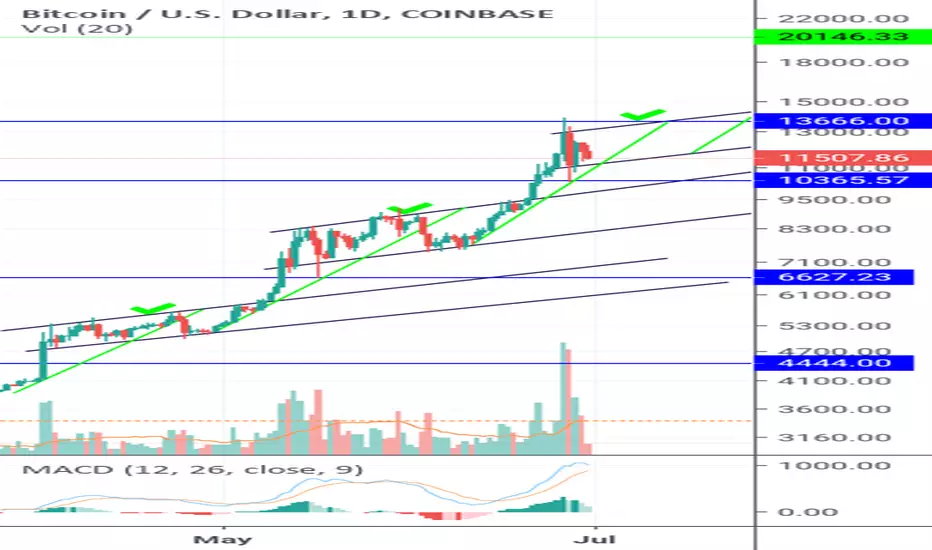
Redid my previous chart for better visuals. Im not a "moonboy" but price action does seem to be following this since capitulation. We're looking at target next of about 20k. 3 waves make a pattern so keep an eye on the bottom support of the current range between 13666 and 11200. 11k should hold and then the 21ema holds. Look at how the 21ema is following my regression line? Look at the previous ones. Now remember, those green regression lines were already plotted before the yellow 21ema then follows. At 20k, we'll see if it forms another wave for higher or what it does. Thanks for reading

관련 발행물
면책사항
해당 정보와 게시물은 금융, 투자, 트레이딩 또는 기타 유형의 조언이나 권장 사항으로 간주되지 않으며, 트레이딩뷰에서 제공하거나 보증하는 것이 아닙니다. 자세한 내용은 이용 약관을 참조하세요.
면책사항
해당 정보와 게시물은 금융, 투자, 트레이딩 또는 기타 유형의 조언이나 권장 사항으로 간주되지 않으며, 트레이딩뷰에서 제공하거나 보증하는 것이 아닙니다. 자세한 내용은 이용 약관을 참조하세요.