
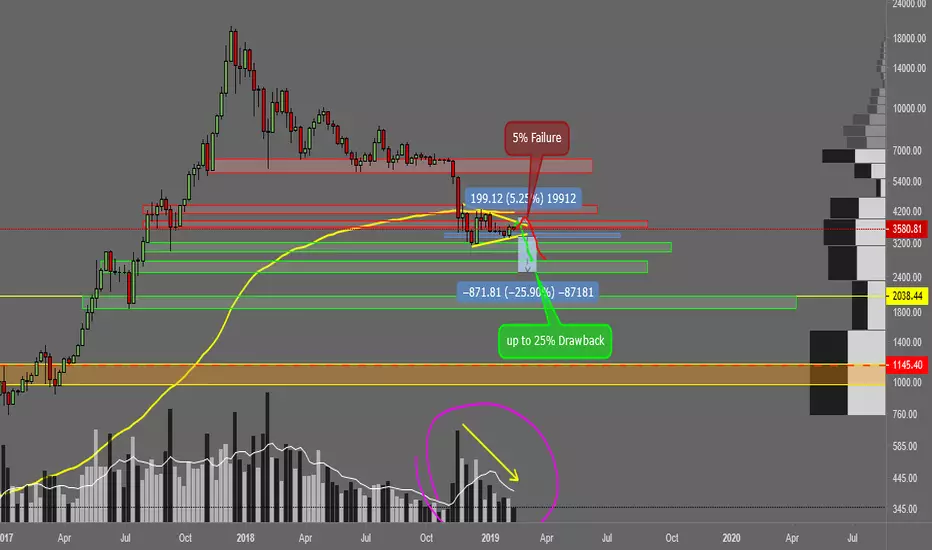
Hey guys, I want to share this idea with y'all.
I think we might be undergoing a symmetrical triangle, which would breakout downwards.
I believe we might test 3000's level, and if it breaks, possibly will go down to 2500's level.
Those levels are ranges calculated by Weekly, Daily and 4H supports/resistance.
I won't give entries this time, because it might be a bit weird. If it breaks the top resistance at 3850, it could do strange things.
I would prefer to wait for a candlestick pattern closure before going into shorting 3850/3950 or not shorting at all :P
Anyways, below 3500 I would be shorting.
I'm going to update this idea :)
Below you have a sum up of a nice encyclopedia :P
/////////////
Encyclopedia of Chart Patterns, Thomas N. Bulkowski, John Wiley.
Triangles, Symmetrical Bottoms. Downside Breakouts.
Appearance: Prices trend down then form lower highs and higher
lows following two sloping trendlines that eventually
intersect. The breakout is downward.
Reversal or consolidation: Short-term (up to 3 months) bearish consolidation
Failure rate: 2% -> 5% price upward.
Average decline: 19%, with most likely decline being 10%
Volume trend: Downward
Premature breakout: 16%
Fullbacks: 57%
Percentage meeting predicted price target: 57%
Surprising findings: Triangles with high volume breakouts show larger
losses. Fullbacks are more likely to occur after a high
volume breakout.
///////////////////
I think we might be undergoing a symmetrical triangle, which would breakout downwards.
I believe we might test 3000's level, and if it breaks, possibly will go down to 2500's level.
Those levels are ranges calculated by Weekly, Daily and 4H supports/resistance.
I won't give entries this time, because it might be a bit weird. If it breaks the top resistance at 3850, it could do strange things.
I would prefer to wait for a candlestick pattern closure before going into shorting 3850/3950 or not shorting at all :P
Anyways, below 3500 I would be shorting.
I'm going to update this idea :)
Below you have a sum up of a nice encyclopedia :P
/////////////
Encyclopedia of Chart Patterns, Thomas N. Bulkowski, John Wiley.
Triangles, Symmetrical Bottoms. Downside Breakouts.
Appearance: Prices trend down then form lower highs and higher
lows following two sloping trendlines that eventually
intersect. The breakout is downward.
Reversal or consolidation: Short-term (up to 3 months) bearish consolidation
Failure rate: 2% -> 5% price upward.
Average decline: 19%, with most likely decline being 10%
Volume trend: Downward
Premature breakout: 16%
Fullbacks: 57%
Percentage meeting predicted price target: 57%
Surprising findings: Triangles with high volume breakouts show larger
losses. Fullbacks are more likely to occur after a high
volume breakout.
///////////////////
노트
New targets :)
면책사항
해당 정보와 게시물은 금융, 투자, 트레이딩 또는 기타 유형의 조언이나 권장 사항으로 간주되지 않으며, 트레이딩뷰에서 제공하거나 보증하는 것이 아닙니다. 자세한 내용은 이용 약관을 참조하세요.
면책사항
해당 정보와 게시물은 금융, 투자, 트레이딩 또는 기타 유형의 조언이나 권장 사항으로 간주되지 않으며, 트레이딩뷰에서 제공하거나 보증하는 것이 아닙니다. 자세한 내용은 이용 약관을 참조하세요.