
Hello,
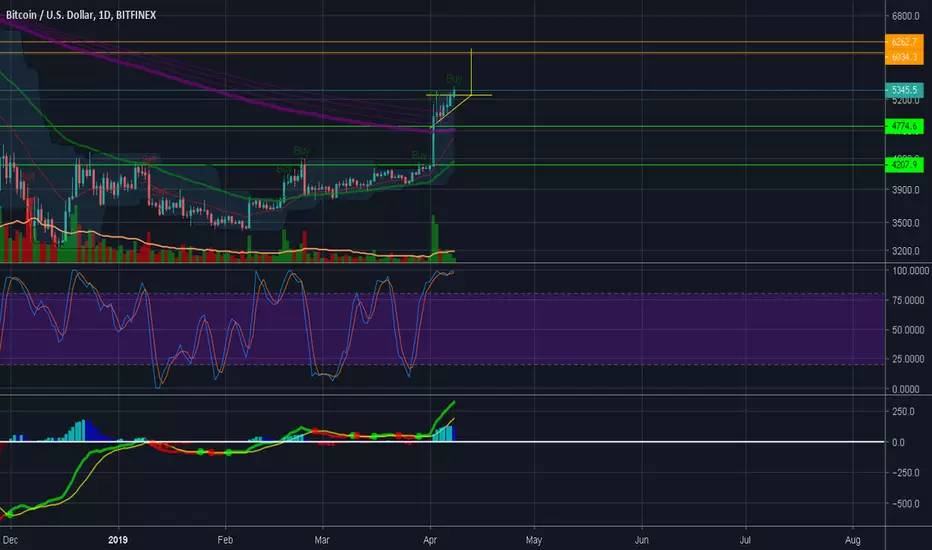
If the price action keep persisting the bull momentum and the bull flag is in play... i think it will come into meet with a high resistance around 6k area and i think there will be a high possibility of retracement into support area provided by 200 EMA to test it's a valid support for continuation of bull momentum (around 5k) ; the reason for me is the all indicator i have beginning to shift into sell momentum..
please take this idea as a grain of salt as i do love to hear what your thought or chart.
peace...
If the price action keep persisting the bull momentum and the bull flag is in play... i think it will come into meet with a high resistance around 6k area and i think there will be a high possibility of retracement into support area provided by 200 EMA to test it's a valid support for continuation of bull momentum (around 5k) ; the reason for me is the all indicator i have beginning to shift into sell momentum..
please take this idea as a grain of salt as i do love to hear what your thought or chart.
peace...
노트
i think it's a self explanatory chart..
I forgot to mention that there's also resistance around 5.5k that act as support and resistance according to price action dated at october - november 2017.
if the bull flag pattern do happen.. it surely will breach that resistance and try to tease 6 k resistance..
:)
노트
노트
ouch my title is wrong.. i wrote Bull flag instead of bull pennant which is different thing.. my bad... all though it could be a possibility case if the bullish momentum still kickin in.

관련 발행물
면책사항
해당 정보와 게시물은 금융, 투자, 트레이딩 또는 기타 유형의 조언이나 권장 사항으로 간주되지 않으며, 트레이딩뷰에서 제공하거나 보증하는 것이 아닙니다. 자세한 내용은 이용 약관을 참조하세요.
관련 발행물
면책사항
해당 정보와 게시물은 금융, 투자, 트레이딩 또는 기타 유형의 조언이나 권장 사항으로 간주되지 않으며, 트레이딩뷰에서 제공하거나 보증하는 것이 아닙니다. 자세한 내용은 이용 약관을 참조하세요.