
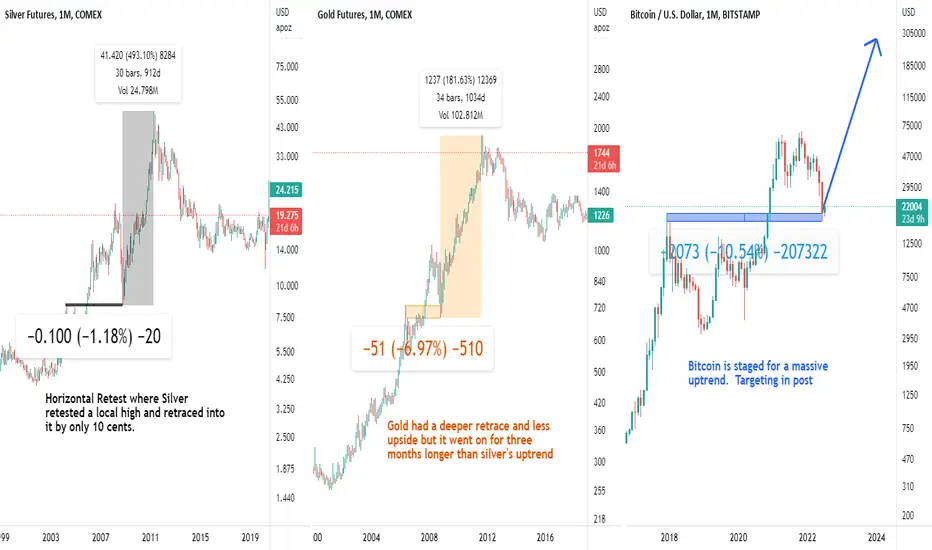
This idea is pretty simple. During a powerful uptrend price can spike up before pulling back and going higher. If price action spikes back down into the previous spike up there is fair chance for a V recovery and higher highs. The price action was volatile on the way up and was volatile on the way down so the pattern suggests a volatile recovery to the upside.
I am using gold and silver for our comparison charts because both of them have a history as a safe haven asset or a hedge against uncertainty and negative real-world volatility and both of them did really well leading up to the 2008 financial crisis and both of them had an initial sell off during the crisis which led to the V shaped recovery then to local highs the next 2-3 years.
The trade is easy. Put on a long and then put a stop under our bottom and find a target. My trades are on alts I think will have more upside but if bitcoin doesn't move the way I hope then my alt trades fail. If I had to say where bitcoin would top if this V shape recovery materialized would be at the fib levels shown below. The 2 and 2.618 would be very technical places for price to stall, consolidate or reverse. The chart also shows that bitcoin stalled at the 1.618 and so this was a very technical sell off. Since the move went up technically, went down technically then my continued operating assumption is that it will recover technically just as silver and gold did in the 2008 and 2009

I am using gold and silver for our comparison charts because both of them have a history as a safe haven asset or a hedge against uncertainty and negative real-world volatility and both of them did really well leading up to the 2008 financial crisis and both of them had an initial sell off during the crisis which led to the V shaped recovery then to local highs the next 2-3 years.
The trade is easy. Put on a long and then put a stop under our bottom and find a target. My trades are on alts I think will have more upside but if bitcoin doesn't move the way I hope then my alt trades fail. If I had to say where bitcoin would top if this V shape recovery materialized would be at the fib levels shown below. The 2 and 2.618 would be very technical places for price to stall, consolidate or reverse. The chart also shows that bitcoin stalled at the 1.618 and so this was a very technical sell off. Since the move went up technically, went down technically then my continued operating assumption is that it will recover technically just as silver and gold did in the 2008 and 2009

And I promise every Floridian that you will all be rich... because we're gonna print some more money! Why didn't anybody ever think of this before?
~Nathan Explosion
~Nathan Explosion
관련 발행물
면책사항
해당 정보와 게시물은 금융, 투자, 트레이딩 또는 기타 유형의 조언이나 권장 사항으로 간주되지 않으며, 트레이딩뷰에서 제공하거나 보증하는 것이 아닙니다. 자세한 내용은 이용 약관을 참조하세요.
And I promise every Floridian that you will all be rich... because we're gonna print some more money! Why didn't anybody ever think of this before?
~Nathan Explosion
~Nathan Explosion
관련 발행물
면책사항
해당 정보와 게시물은 금융, 투자, 트레이딩 또는 기타 유형의 조언이나 권장 사항으로 간주되지 않으며, 트레이딩뷰에서 제공하거나 보증하는 것이 아닙니다. 자세한 내용은 이용 약관을 참조하세요.