Bitcoin's Spinning Top Candlestick Pattern
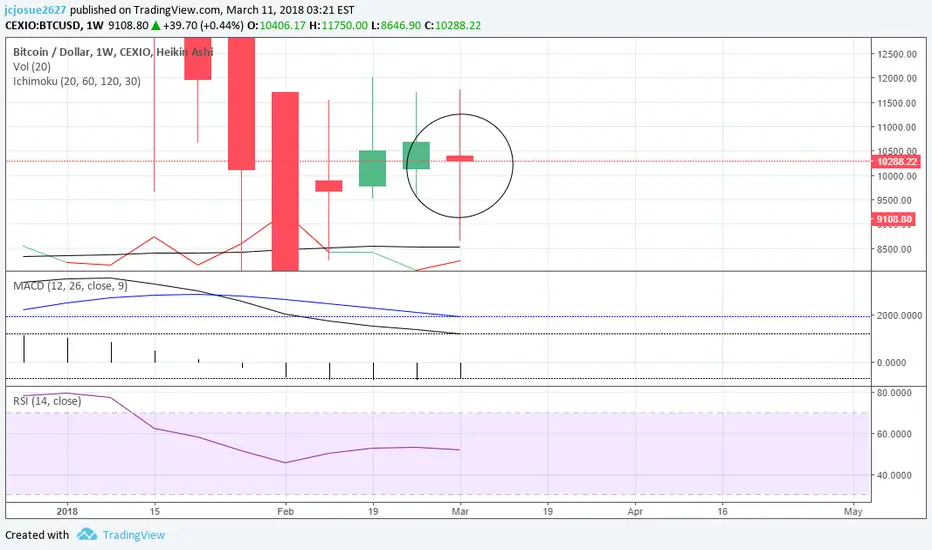
Bitcoin's 1 wk time frame candlestick pattern is telling us that there is an indecision in market. Probably, we may have a sideways type of market then continue it's uptrend after the bulls win.
Usually, traders use spinning tops as a sign to close out long positions and they look for opportunities and potential coin for short positions.
MACD isn't crossing in the 1 wk time frame yet that's why I can see that Bitcoin is still in a correction. We may not know how long will it take before the beginning of a new market cycle and perform higher highs but I believe that we have to eliminate the weak hands first before volume spikes.
RSI is in the middle and it shows that we will be in a consolidation phase or sideways market.
Key is to Patiently HOLD.. because after all these correction, there will be a rise.
LONG LIVE BITCOIN!
Usually, traders use spinning tops as a sign to close out long positions and they look for opportunities and potential coin for short positions.
MACD isn't crossing in the 1 wk time frame yet that's why I can see that Bitcoin is still in a correction. We may not know how long will it take before the beginning of a new market cycle and perform higher highs but I believe that we have to eliminate the weak hands first before volume spikes.
RSI is in the middle and it shows that we will be in a consolidation phase or sideways market.
Key is to Patiently HOLD.. because after all these correction, there will be a rise.
LONG LIVE BITCOIN!

면책사항
해당 정보와 게시물은 금융, 투자, 트레이딩 또는 기타 유형의 조언이나 권장 사항으로 간주되지 않으며, 트레이딩뷰에서 제공하거나 보증하는 것이 아닙니다. 자세한 내용은 이용 약관을 참조하세요.
면책사항
해당 정보와 게시물은 금융, 투자, 트레이딩 또는 기타 유형의 조언이나 권장 사항으로 간주되지 않으며, 트레이딩뷰에서 제공하거나 보증하는 것이 아닙니다. 자세한 내용은 이용 약관을 참조하세요.