
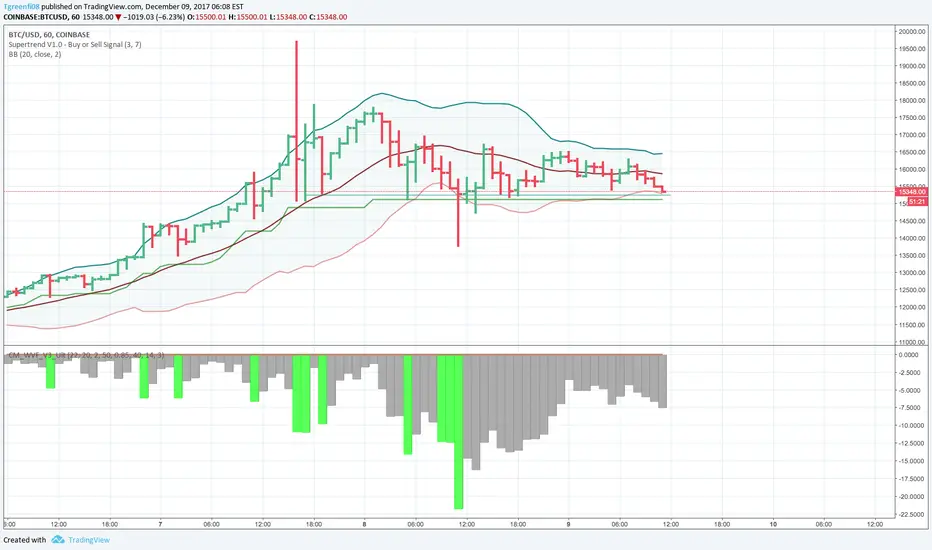
As a followup to my last post, this is another way to see if you're catching Bitcoin in a swing.
If the price is way above the Bollinger Bands, it's an indicator that you may want to sell, and buy it back at a lower price. Way below? This is a good indication that you may want to buy. Combine this with the CM_Williams_VIx_Fix_V3_Ultimate_Filtered_Alerts, and this can be another supportive indicator of whether the price is outside of the norm. With this indicator, it seems to me that both the thickness (multiple bars together) and/or length of the green bars are indicators of abnormal price activity.
See previous post for the fuller strategy.

면책사항
해당 정보와 게시물은 금융, 투자, 트레이딩 또는 기타 유형의 조언이나 권장 사항으로 간주되지 않으며, 트레이딩뷰에서 제공하거나 보증하는 것이 아닙니다. 자세한 내용은 이용 약관을 참조하세요.
면책사항
해당 정보와 게시물은 금융, 투자, 트레이딩 또는 기타 유형의 조언이나 권장 사항으로 간주되지 않으며, 트레이딩뷰에서 제공하거나 보증하는 것이 아닙니다. 자세한 내용은 이용 약관을 참조하세요.