
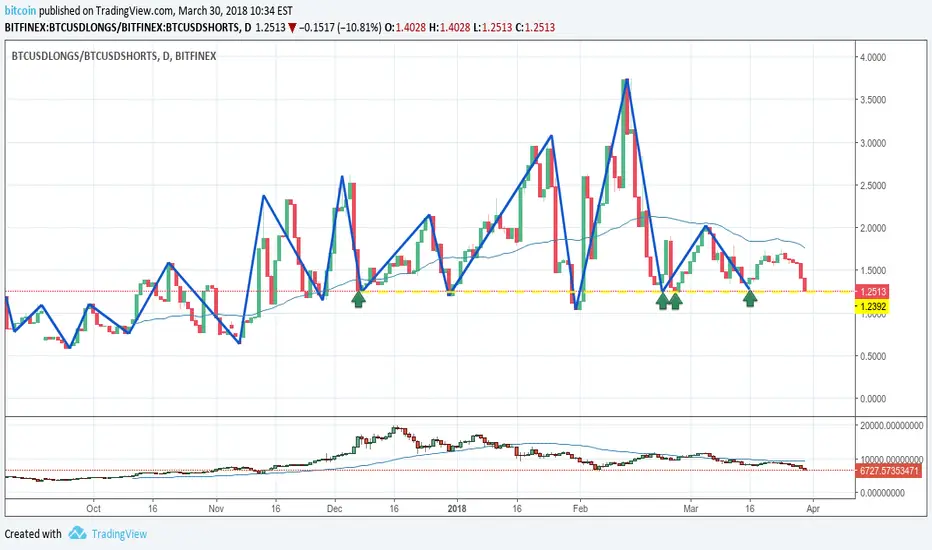
By taking longs/shorts ratio we get a cyclic chart and it is near past history lows. But as always it can break down on extreme panic sells and BTC is yet to see some panic like previous leg down to 6K. So I am sharing this as a point of attention.
노트
Longs making a new high after hitting way lower than recent bottoms노트
Looks like a return to mean is probable노트
There is a double bottom so far, looking like it failed to bearish engulfing.노트
double bottom lost, ratio is below 1 which means shorts are greater than longs, that's the lowest ratio in 2018노트
Increasing bears margin with market going upward노트
Bulls about to make a new higher high
면책사항
해당 정보와 게시물은 금융, 투자, 트레이딩 또는 기타 유형의 조언이나 권장 사항으로 간주되지 않으며, 트레이딩뷰에서 제공하거나 보증하는 것이 아닙니다. 자세한 내용은 이용 약관을 참조하세요.
면책사항
해당 정보와 게시물은 금융, 투자, 트레이딩 또는 기타 유형의 조언이나 권장 사항으로 간주되지 않으며, 트레이딩뷰에서 제공하거나 보증하는 것이 아닙니다. 자세한 내용은 이용 약관을 참조하세요.