
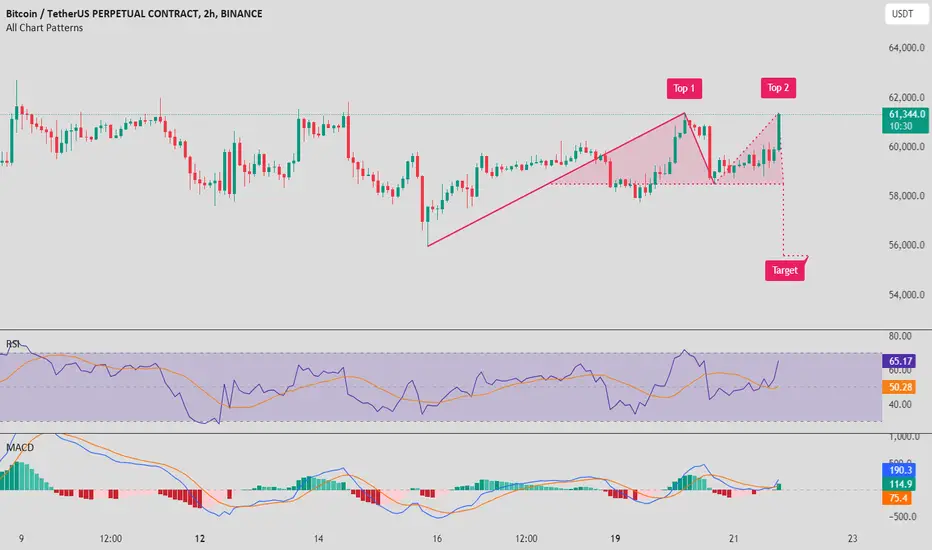
It looks like Bitcoin has formed a rising wedge pattern on the 2-hour chart, which typically indicates a potential bearish reversal. The pattern has already reached its second top, and the price seems to be breaking down from the wedge. The target for this breakdown could be around $56,000, which aligns with the support zone from earlier price action. The RSI is near overbought territory, suggesting that the momentum might be fading, and the MACD is showing early signs of a bearish crossover. Keep an eye on the volume to confirm this breakdown; if it picks up, we might see a sharper decline.

면책사항
해당 정보와 게시물은 금융, 투자, 트레이딩 또는 기타 유형의 조언이나 권장 사항으로 간주되지 않으며, 트레이딩뷰에서 제공하거나 보증하는 것이 아닙니다. 자세한 내용은 이용 약관을 참조하세요.
면책사항
해당 정보와 게시물은 금융, 투자, 트레이딩 또는 기타 유형의 조언이나 권장 사항으로 간주되지 않으며, 트레이딩뷰에서 제공하거나 보증하는 것이 아닙니다. 자세한 내용은 이용 약관을 참조하세요.