
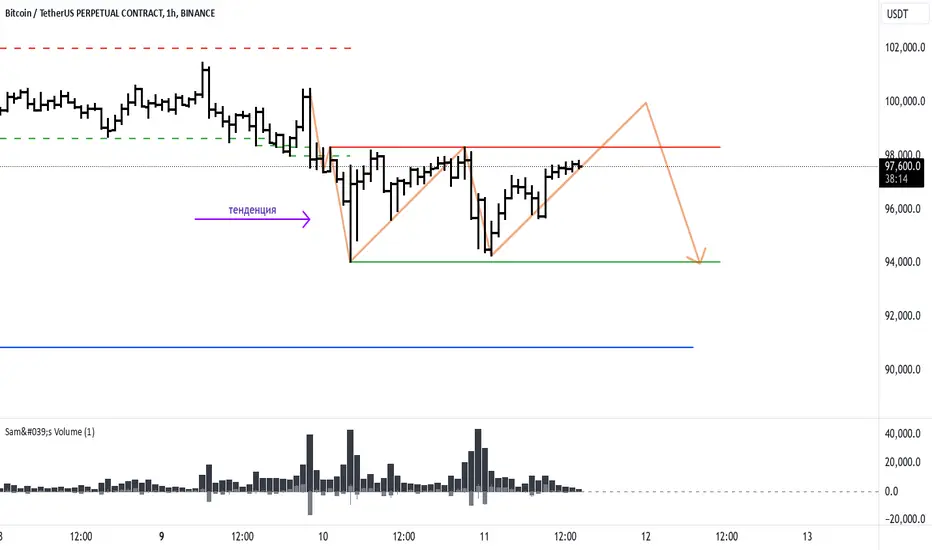
It looks like the market's been moving sideways on the 1-hour chart. Yesterday, December 10, 2024, the price slowly climbed to the resistance level at 98,341 and then took a sharp dive. We were hoping for a more obvious fake-out at that resistance, but instead, the price just touched the level and dropped. After that steep fall, buyers pushed the price back up, but with less volume than during the drop.
Given that the daily and weekly charts show resistance around 100,000, I'm expecting a clearer fake-out at the 1-hour resistance level, followed by a drop to the 1-hour support. Since the daily chart also shows a sideways movement, it's not too far-fetched to think the price might hit the daily support around 90,800. Let's wait and see how things play out.
Given that the daily and weekly charts show resistance around 100,000, I'm expecting a clearer fake-out at the 1-hour resistance level, followed by a drop to the 1-hour support. Since the daily chart also shows a sideways movement, it's not too far-fetched to think the price might hit the daily support around 90,800. Let's wait and see how things play out.
노트
At 9:00 PM (UTC+7), the price broke above the resistance level, invalidating previous short-selling plans. No spring signals were observed on the 5-minute chart during the breakout. It's advisable to wait for new levels to form before considering new positions. 주문취소됨

면책사항
해당 정보와 게시물은 금융, 투자, 트레이딩 또는 기타 유형의 조언이나 권장 사항으로 간주되지 않으며, 트레이딩뷰에서 제공하거나 보증하는 것이 아닙니다. 자세한 내용은 이용 약관을 참조하세요.
면책사항
해당 정보와 게시물은 금융, 투자, 트레이딩 또는 기타 유형의 조언이나 권장 사항으로 간주되지 않으며, 트레이딩뷰에서 제공하거나 보증하는 것이 아닙니다. 자세한 내용은 이용 약관을 참조하세요.