
Greetings, everyone.😉
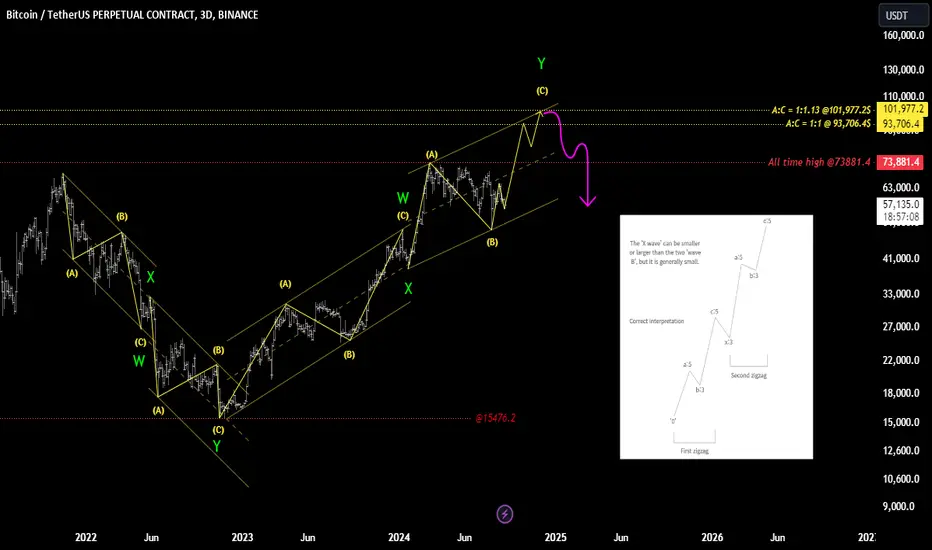
I would like to present a scenario for your consideration, grounded in "Elliott Wave Theory".
[Recent Chart Zoomed In]

✔️ Wave initiated from the 15K level: Classified as a "Double Zigzag"
✔️ Current wave in development: Y-c-3
✔️ Projected upward range: 93K ~ 101K
The rationale behind this analysis is as follows:
Based on these observations, I have constructed this particular scenario. It is an illustrative representation of potential market behavior, grounded in established technical principles. Wishing you all the best of luck.
I would like to present a scenario for your consideration, grounded in "Elliott Wave Theory".
[Recent Chart Zoomed In]
✔️ Wave initiated from the 15K level: Classified as a "Double Zigzag"
✔️ Current wave in development: Y-c-3
✔️ Projected upward range: 93K ~ 101K
The rationale behind this analysis is as follows:
- Zigzag patterns typically move within a parallel channel.
- The first zigzag wave, which started from the 15K level, adhered precisely to this parallel channel.
- As a result, the likelihood of a complex correction occurring is considerably high.
Based on these observations, I have constructed this particular scenario. It is an illustrative representation of potential market behavior, grounded in established technical principles. Wishing you all the best of luck.
- This is not a buy or sell recommendation.
- It is a personal perspective and should be used for reference only.
- All decisions and responsibilities lie with you.

관련 발행물
면책사항
해당 정보와 게시물은 금융, 투자, 트레이딩 또는 기타 유형의 조언이나 권장 사항으로 간주되지 않으며, 트레이딩뷰에서 제공하거나 보증하는 것이 아닙니다. 자세한 내용은 이용 약관을 참조하세요.
면책사항
해당 정보와 게시물은 금융, 투자, 트레이딩 또는 기타 유형의 조언이나 권장 사항으로 간주되지 않으며, 트레이딩뷰에서 제공하거나 보증하는 것이 아닙니다. 자세한 내용은 이용 약관을 참조하세요.