TR 
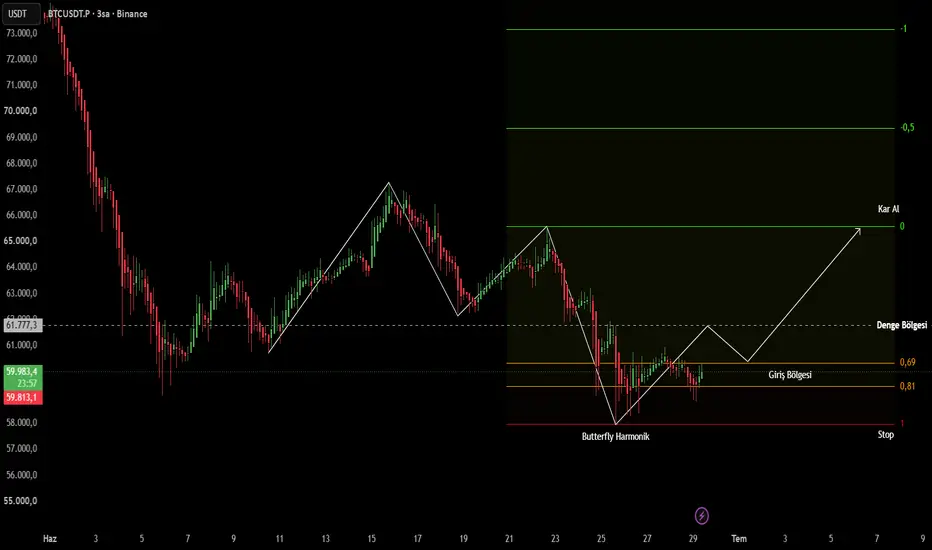
 BTCUSDT 3 saatlik grafikte düşüş trendinin son likidite alımının ardından fiyatın dip bölgede güçlü bir Butterfly (Kelebek) Harmonik Formasyonu oluşturduğu görülmektedir.
Fiyatın bu dipten başlattığı ilk tepki hareketinin ardından düzeltmesini yaptığı 0.69 - 0.81 Fibonacci optimizasyon bandı, long yönlü pozisyona dahil olmak için asimetrik bir risk/ödül oranı sunmaktadır. Formasyonun iptal seviyesi (1 çizgisi) stop kabul edilerek, üst taraftaki majör direnç yapısı hedeflenmiştir.
Giriş Alanı: 0.69 - 0.81 Kutusu
Stop-Loss: 1 Seviyesi altı (3S mum kapanışı)
Ana Hedef (TP): 65.500 (0 Seviyesi)
ENG Following the completion of the previous bearish expansion, BTCUSDT has tapped into a major HTF demand area on the 3-hour chart, printing a high-probability Butterfly Harmonic Pattern.
The initial reaction from the absolute bottom shows early signs of a trend reversal. The subsequent corrective pullback into our optimized entry window—the 0.69 - 0.81 Fibonacci retracement zone—provides an asymmetric risk-to-reward ratio (R:R > 1:4) for a long positioning.
While navigating this counter-trend setup, maintaining strict risk discipline remains paramount. The invalidation level is clearly defined just below the harmonic completion point.
Entry Zone: 0.69 - 0.81 Optimisation Box (Current Consolidation Area)
Stop-Loss: Just below Level 1 (Invalidation point on 3H close)
Take-Profit (TP): 65,500 (Level 0 / Major Supply & Equilibrium)
#bitcoin #btcusdt #harmonic #butterfly #long #priceaction
BTCUSDT 3 saatlik grafikte düşüş trendinin son likidite alımının ardından fiyatın dip bölgede güçlü bir Butterfly (Kelebek) Harmonik Formasyonu oluşturduğu görülmektedir.Fiyatın bu dipten başlattığı ilk tepki hareketinin ardından düzeltmesini yaptığı 0.69 - 0.81 Fibonacci optimizasyon bandı, long yönlü pozisyona dahil olmak için asimetrik bir risk/ödül oranı sunmaktadır. Formasyonun iptal seviyesi (1 çizgisi) stop kabul edilerek, üst taraftaki majör direnç yapısı hedeflenmiştir.
Giriş Alanı: 0.69 - 0.81 Kutusu
Stop-Loss: 1 Seviyesi altı (3S mum kapanışı)
Ana Hedef (TP): 65.500 (0 Seviyesi)
ENG Following the completion of the previous bearish expansion, BTCUSDT has tapped into a major HTF demand area on the 3-hour chart, printing a high-probability Butterfly Harmonic Pattern.
The initial reaction from the absolute bottom shows early signs of a trend reversal. The subsequent corrective pullback into our optimized entry window—the 0.69 - 0.81 Fibonacci retracement zone—provides an asymmetric risk-to-reward ratio (R:R > 1:4) for a long positioning.
While navigating this counter-trend setup, maintaining strict risk discipline remains paramount. The invalidation level is clearly defined just below the harmonic completion point.
Entry Zone: 0.69 - 0.81 Optimisation Box (Current Consolidation Area)
Stop-Loss: Just below Level 1 (Invalidation point on 3H close)
Take-Profit (TP): 65,500 (Level 0 / Major Supply & Equilibrium)
#bitcoin #btcusdt #harmonic #butterfly #long #priceaction

관련 발행물
면책사항
해당 정보와 게시물은 금융, 투자, 트레이딩 또는 기타 유형의 조언이나 권장 사항으로 간주되지 않으며, 트레이딩뷰에서 제공하거나 보증하는 것이 아닙니다. 자세한 내용은 이용 약관을 참조하세요.
면책사항
해당 정보와 게시물은 금융, 투자, 트레이딩 또는 기타 유형의 조언이나 권장 사항으로 간주되지 않으며, 트레이딩뷰에서 제공하거나 보증하는 것이 아닙니다. 자세한 내용은 이용 약관을 참조하세요.