
Bitcoin LTF Overview
Overview:
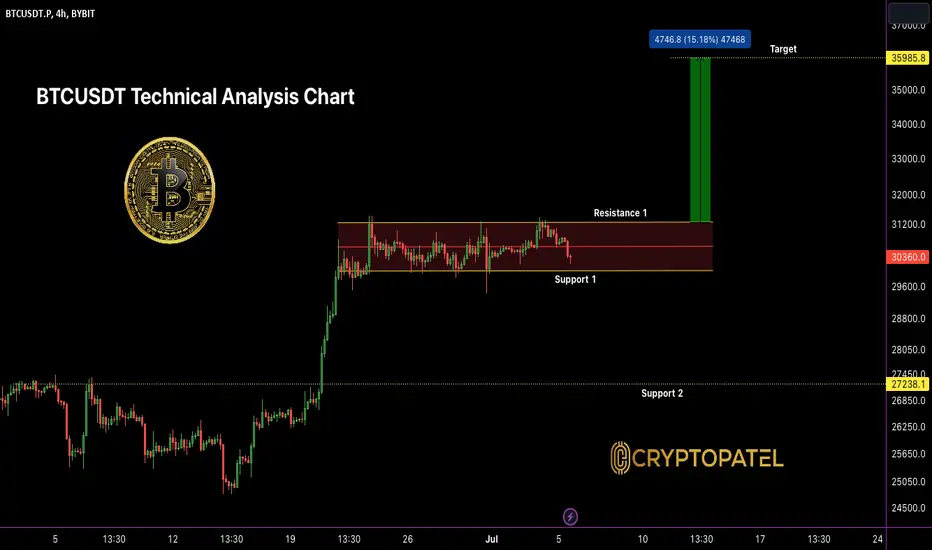
Bitcoin is currently trading within a range of $30,000 to $31,200, with the chart indicating a focus within this range. A bull flag formation is observed in the 4-hour time frame, suggesting the potential for an upward breakout towards $36,000. However, it is important to consider a bearish scenario where Bitcoin breaks down below $30,000 and retests the $27,200 level.
Key Levels:
Support: $30,000
Resistance: $31,200
Trade Analysis:
Upside Breakout: If Bitcoin breaks above the $31,200 level, it may indicate a bullish continuation. In this case, the potential target would be around $36,000.
Downside Breakout: Conversely, if Bitcoin breaks below the $30,000 level, it could signify a bearish move. The next support level to watch would be around $27,200.
Please note that these levels are provided as general guidelines and should be evaluated in conjunction with other technical indicators, market sentiment, and risk management strategies.
CryptoPatel Recommendations:
Monitor Breakout: Keep a close eye on Bitcoin's price movement within the defined range and be prepared to act upon a breakout.
Risk Management: Implement appropriate risk management strategies, such as setting stop-loss orders or using trailing stops, to protect capital and limit potential losses.
Confirmation: Consider waiting for confirmation of a breakout or breakdown through additional technical indicators or chart patterns before entering a trade.
Stay Informed: Continuously follow market updates, news, and changes in market sentiment to stay informed about potential developments that may impact Bitcoin's price.

Twitter: twitter.com/CryptoPatel
Telegram: t.me/OfficialCryptoPatel
Instagram: instagram.com/cryptopatel?utm_medium=copy_link
Telegram: t.me/OfficialCryptoPatel
Instagram: instagram.com/cryptopatel?utm_medium=copy_link
관련 발행물
면책사항
해당 정보와 게시물은 금융, 투자, 트레이딩 또는 기타 유형의 조언이나 권장 사항으로 간주되지 않으며, 트레이딩뷰에서 제공하거나 보증하는 것이 아닙니다. 자세한 내용은 이용 약관을 참조하세요.