
Trader’s Mindset: The First Fundamental Stone & Key Observations
Trader’s Mindset: The First Fundamental Stone of the Market
Stop asking, “How much profit did I make?”
Start asking, “What is my winning probability?”
📊 In trading, consistency beats randomness.
It’s not about one big win — it’s about repeating a high-probability edge again and again.
💭 Smart traders don’t chase money…
They focus on accuracy, discipline, and data-backed decisions.
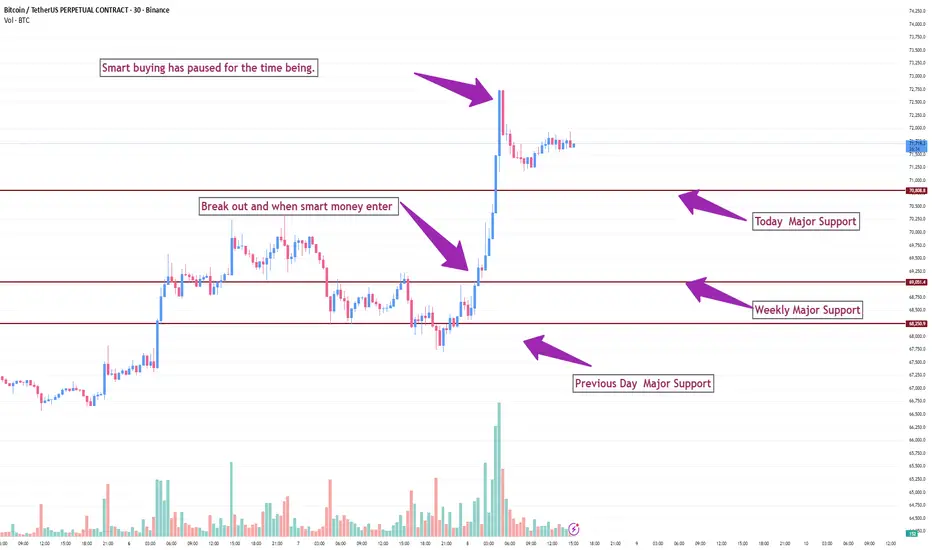
TradingView chart for the Bitcoin/Tether Perpetual Contract (30m timeframe, April 8, 2026), .
Key Observations:
Sequential Breakouts: The move originated with a breakout above the 'Weekly Major Support' level (approx. $69,400). This was followed by a subsequent breakout with significant volume above 'Today’s Major Support' (approx. $71,800), labelled as an entry by "smart money."
Current State: Following this surge, upward momentum has slowed ("Smart buying has paused"). Price is currently in a technical pullback, retesting the 'Today’s Major Support' level.
Support Structure: The chart identifies three distinct support levels: Today's ($71,800), Weekly ($69,400), and Previous Day ($68,200).
Stop asking, “How much profit did I make?”
Start asking, “What is my winning probability?”
📊 In trading, consistency beats randomness.
It’s not about one big win — it’s about repeating a high-probability edge again and again.
💭 Smart traders don’t chase money…
They focus on accuracy, discipline, and data-backed decisions.
TradingView chart for the Bitcoin/Tether Perpetual Contract (30m timeframe, April 8, 2026), .
Key Observations:
Sequential Breakouts: The move originated with a breakout above the 'Weekly Major Support' level (approx. $69,400). This was followed by a subsequent breakout with significant volume above 'Today’s Major Support' (approx. $71,800), labelled as an entry by "smart money."
Current State: Following this surge, upward momentum has slowed ("Smart buying has paused"). Price is currently in a technical pullback, retesting the 'Today’s Major Support' level.
Support Structure: The chart identifies three distinct support levels: Today's ($71,800), Weekly ($69,400), and Previous Day ($68,200).

면책사항
해당 정보와 게시물은 금융, 투자, 트레이딩 또는 기타 유형의 조언이나 권장 사항으로 간주되지 않으며, 트레이딩뷰에서 제공하거나 보증하는 것이 아닙니다. 자세한 내용은 이용 약관을 참조하세요.
면책사항
해당 정보와 게시물은 금융, 투자, 트레이딩 또는 기타 유형의 조언이나 권장 사항으로 간주되지 않으며, 트레이딩뷰에서 제공하거나 보증하는 것이 아닙니다. 자세한 내용은 이용 약관을 참조하세요.