
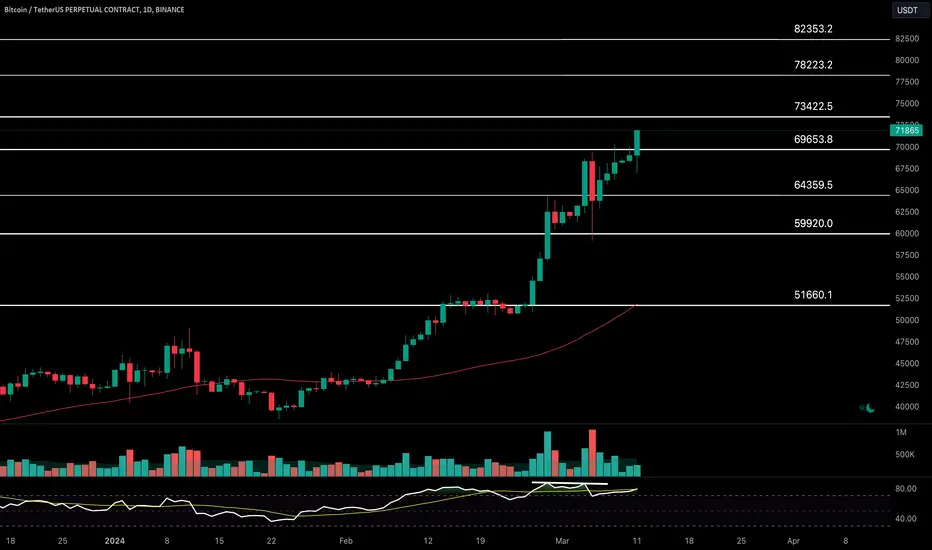
Today, Bitcoin entered the key daily resistance zone of $69,654-$73,422 and is moving to the top of this zone.
The price action with $69,654-$73,422 is very important.
The daily candle closure above this zone will push Bitcoin price higher towards $78,223-$82,353.
An inability to sustain the price action above $69,654 could push BTC price towards the minor support at $64,360 and, possibly, lower the key daily support of $59,920.
Intraday Chart

The intraday chart is interacting with the key resistance zone of $67,901-$70,177.
From its current price location or after re-test of $70,553, a bullish move to $73,234-$75,142 is very likely.
A quick move up and a bearish rejection of $73,234-$75,142 could lead to re-test of $68,305, the key intraday support.
A bullish break-out of $73,234-$75,142 will help bulls to take a control of the intraday chart and BTC price will move towards $78,000.
Like once read.
Thank you!
The price action with $69,654-$73,422 is very important.
The daily candle closure above this zone will push Bitcoin price higher towards $78,223-$82,353.
An inability to sustain the price action above $69,654 could push BTC price towards the minor support at $64,360 and, possibly, lower the key daily support of $59,920.
Intraday Chart
The intraday chart is interacting with the key resistance zone of $67,901-$70,177.
From its current price location or after re-test of $70,553, a bullish move to $73,234-$75,142 is very likely.
A quick move up and a bearish rejection of $73,234-$75,142 could lead to re-test of $68,305, the key intraday support.
A bullish break-out of $73,234-$75,142 will help bulls to take a control of the intraday chart and BTC price will move towards $78,000.
Like once read.
Thank you!
노트
In the last few days, we saw a bearishness from the Cryptolean resistance zone $69,654-$73,423 called out for the last 2 weeks. Yesterday's daily candle closed below $69,654 and to exclude a fake-out I would like to see another daily candle closure below this level
A sustained price action below $69,654 will push #BTC price towards the minor support at $64,360 and, possibly, lower the key daily support of $59,920.
Bitcoin has to move bullish and break through $73,423 for another bullish extension towards $78,223-$82,353.
Intraday Chart
After testing the bottom of intraday resistance zone of $73,234-$75,142, Bitcoin is still trading in the bullish territory above $68,305.
From its current price location or after re-test of $68,305, a bullish move to $73,234-$75,142 is likely.
A re-test of $70.553 and a bearish rejection or a bearish break-out of $68,305 could lead price o re-test of $66,214 and lower to $64,123, the key intraday support.

Check out the daily market updates on youtube.com/@TradeLeanCom
관련 발행물
면책사항
해당 정보와 게시물은 금융, 투자, 트레이딩 또는 기타 유형의 조언이나 권장 사항으로 간주되지 않으며, 트레이딩뷰에서 제공하거나 보증하는 것이 아닙니다. 자세한 내용은 이용 약관을 참조하세요.
Check out the daily market updates on youtube.com/@TradeLeanCom
관련 발행물
면책사항
해당 정보와 게시물은 금융, 투자, 트레이딩 또는 기타 유형의 조언이나 권장 사항으로 간주되지 않으며, 트레이딩뷰에서 제공하거나 보증하는 것이 아닙니다. 자세한 내용은 이용 약관을 참조하세요.