
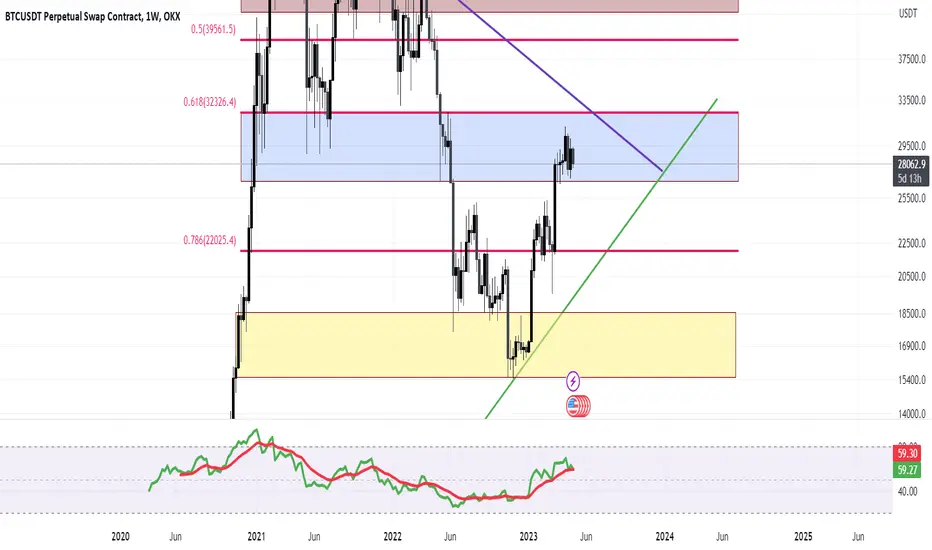
Hello everyone👋 Here is the #Bitcoin Analyze ( OKX:BTCUSDT), on weekly time frame.
To analyze #Bitcoin chart, I used Fibonacci, RSI and Bollinger Bands indicators and identified resistance and support zones on the chart.
As we can see it is BTC/USDT weekly chart.
Bitcoin is moving in a heavy resistance zone: 31,200-
 26,800
If we look at RSI indicator we can see that RSI middle band is over 50 and it can help to Bitcoin to reach it's upper resistance, it is 32,400, if Bitcoin price can break 32,400 with high volume, and make weekly candle close above it, Bitcoin's next resistances are $35200 - $36800 - $39200 - $42500 and this movement will be good for altcoins, we can see rally for altcoins.
If Bitcoin price lose26,800 support zone and make wekly candle close below $26800, then Bitcoin price can go to this support zones:  25,200 -
  22,222. This prices will be good support zones for Bitcoin.
Hope you find this post useful. It's important to always get best position for your trading plan and make risk management strategies. Don't forget to use stop-loss for your positions.
Please press the like button & Share it with your friends.
Thanks you all readers and Trade safe. DYOR.
To analyze #Bitcoin chart, I used Fibonacci, RSI and Bollinger Bands indicators and identified resistance and support zones on the chart.
As we can see it is BTC/USDT weekly chart.
Bitcoin is moving in a heavy resistance zone:
31,200-26,800If we look at RSI indicator we can see that RSI middle band is over 50 and it can help to Bitcoin to reach it's upper resistance, it is
32,400, if Bitcoin price can break 32,400 with high volume, and make weekly candle close above it, Bitcoin's next resistances are $35200 - $36800 - $39200 - $42500 and this movement will be good for altcoins, we can see rally for altcoins.If Bitcoin price lose
26,800 support zone and make wekly candle close below $26800, then Bitcoin price can go to this support zones: 25,200 - 22,222. This prices will be good support zones for Bitcoin.Hope you find this post useful. It's important to always get best position for your trading plan and make risk management strategies. Don't forget to use stop-loss for your positions.
Please press the like button & Share it with your friends.
Thanks you all readers and Trade safe. DYOR.
노트
some of the written prices are changed to HKEX:.. , so i updated prices:Bitcoin is moving in a heavy resistance zone: $31200-$26800
If we look at RSI indicator we can see that RSI middle band is over 50 and it can help to Bitcoin to reach it's upper resistance, it is $32400, if Bitcoin price can break $32400 with high volume, and make weekly candle close above it, Bitcoin's next resistances are $35200 - $36800 - $39200 - $42500 and this movement will be good for altcoins, we can see rally for altcoins.
If Bitcoin price lose 26800 support zone and make wekly candle close below $26800, then Bitcoin price can go to this support zones: $25200 - $22222. This prices will be good support zones for Bitcoin.

면책사항
해당 정보와 게시물은 금융, 투자, 트레이딩 또는 기타 유형의 조언이나 권장 사항으로 간주되지 않으며, 트레이딩뷰에서 제공하거나 보증하는 것이 아닙니다. 자세한 내용은 이용 약관을 참조하세요.
면책사항
해당 정보와 게시물은 금융, 투자, 트레이딩 또는 기타 유형의 조언이나 권장 사항으로 간주되지 않으며, 트레이딩뷰에서 제공하거나 보증하는 것이 아닙니다. 자세한 내용은 이용 약관을 참조하세요.