
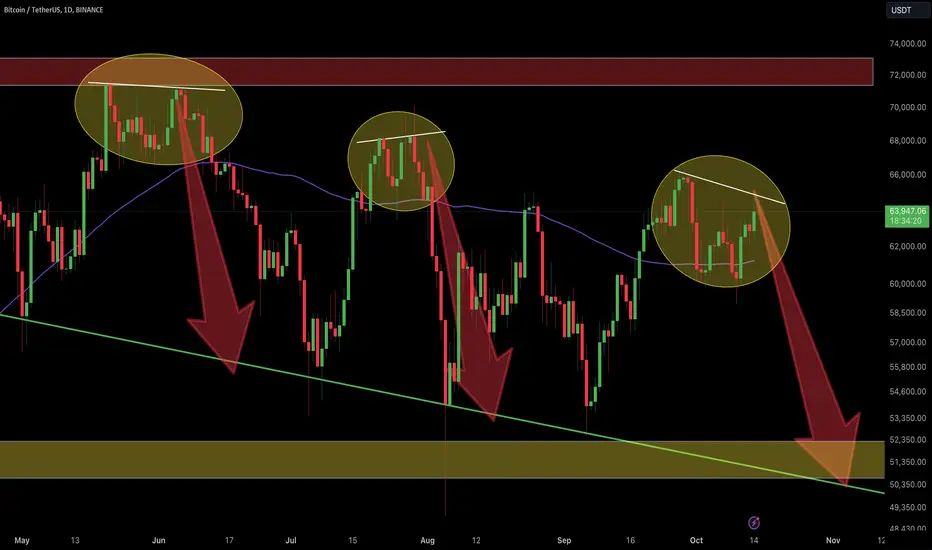
Bitcoin's price action continues to develop within the descending broadening wedge pattern, highlighting a potential bearish trend as it faces resistance at the upper levels. As indicated in the chart, the repeated rejections suggest that the price might move downward toward the support levels.
Bitcoin has faced multiple rejections at the top of the wedge, each time leading to a significant downward move.
The large red arrows in the chart indicate the potential risk of further downward pressure if the price fails to break above the resistance levels.
If the price fails to break out to the upside, a drop towards the lower trendline of the wedge could be expected.
Waiting for a confirmed breakout above the descending wedge is crucial to enter a long position.
Implement a stop-loss below the lower boundary of the wedge to manage risk.
If a breakout happens, monitor the key resistance zones around the $66,000 to $70,000 range for possible profit-taking.
Monitoring Bitcoin's movement around these critical levels will provide insights into the potential bullish or bearish breakout. Let me know if you need a more detailed analysis!
Disclaimer: This analysis is for informational purposes and is not financial advice. Always stay updated with market movements and adjust your trading strategies as needed.
You can DM us for information on any other altcoin.
@Peter_CSAdmin

관련 발행물
면책사항
해당 정보와 게시물은 금융, 투자, 트레이딩 또는 기타 유형의 조언이나 권장 사항으로 간주되지 않으며, 트레이딩뷰에서 제공하거나 보증하는 것이 아닙니다. 자세한 내용은 이용 약관을 참조하세요.
관련 발행물
면책사항
해당 정보와 게시물은 금융, 투자, 트레이딩 또는 기타 유형의 조언이나 권장 사항으로 간주되지 않으며, 트레이딩뷰에서 제공하거나 보증하는 것이 아닙니다. 자세한 내용은 이용 약관을 참조하세요.