
Bitcoin (BTC/USDT) Analysis:
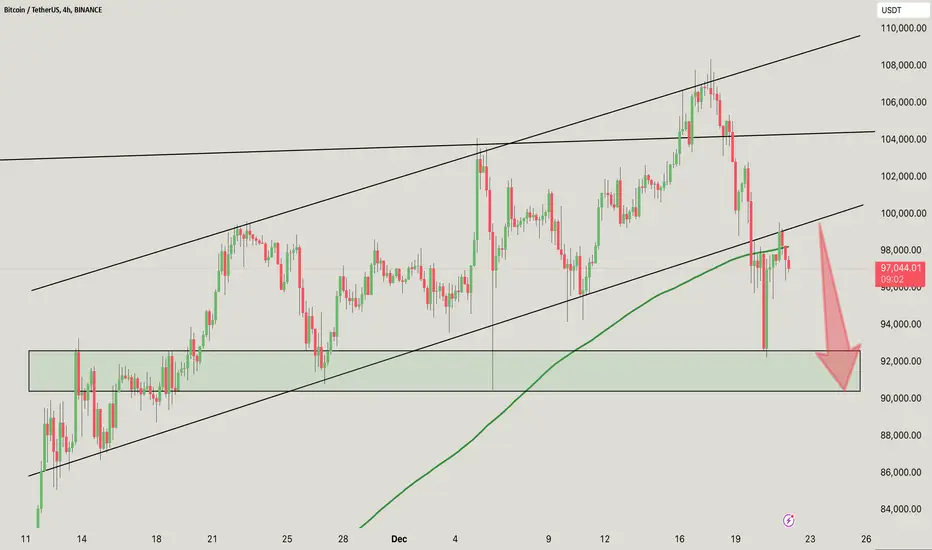
The green box marks a crucial support level between $90,000 and $92,500.
Historically, this area has acted as a strong demand zone where buyers have stepped in to increase prices.
The price has broken below the mid-boundary of the ascending channel and is currently trading near the lower boundary.
A retest of the green box is possible if the bearish momentum persists.
The green moving average (possibly 200 EMA or similar) is slightly above the current price. This suggests that the price is losing upward momentum and the moving average could act as resistance on any bounce.
The red arrow on the chart indicates a possible move downwards towards the green support zone.
DYOR, NFA
@Peter_CSAdmin
The green box marks a crucial support level between $90,000 and $92,500.
Historically, this area has acted as a strong demand zone where buyers have stepped in to increase prices.
The price has broken below the mid-boundary of the ascending channel and is currently trading near the lower boundary.
A retest of the green box is possible if the bearish momentum persists.
The green moving average (possibly 200 EMA or similar) is slightly above the current price. This suggests that the price is losing upward momentum and the moving average could act as resistance on any bounce.
The red arrow on the chart indicates a possible move downwards towards the green support zone.
DYOR, NFA
@Peter_CSAdmin

관련 발행물
면책사항
해당 정보와 게시물은 금융, 투자, 트레이딩 또는 기타 유형의 조언이나 권장 사항으로 간주되지 않으며, 트레이딩뷰에서 제공하거나 보증하는 것이 아닙니다. 자세한 내용은 이용 약관을 참조하세요.
관련 발행물
면책사항
해당 정보와 게시물은 금융, 투자, 트레이딩 또는 기타 유형의 조언이나 권장 사항으로 간주되지 않으며, 트레이딩뷰에서 제공하거나 보증하는 것이 아닙니다. 자세한 내용은 이용 약관을 참조하세요.