
Overview:
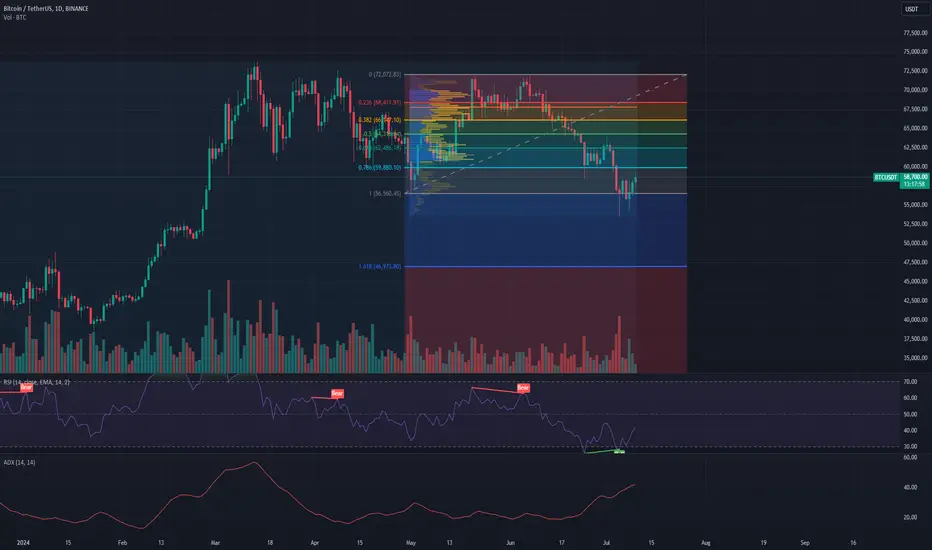
In this analysis, I present a short trade setup for BTC/USD with an entry point around $61,000. This idea is based on the confluence of volume profile levels and Fibonacci retracement zones.
Volume Profile Analysis:
The volume profile indicates significant trading activity around the $61,000 level, which suggests it as a strong resistance zone. This implies that there may be considerable selling pressure once the price reaches this level.
Fibonacci Retracement:
Applying the Fibonacci retracement from the swing high to the recent swing low, the 0.618 retracement level aligns closely with the $61,000 mark. This confluence adds strength to the resistance at this level, providing a high-probability short entry.
RSI and ADX Indicators:
The Relative Strength Index (RSI) is currently showing bearish divergence, indicating a potential reversal or pullback.
The Average Directional Index (ADX) is at a high level, suggesting a strong trend which could soon see a correction.
Trade Setup:
Entry: Short at $61,000
Stop Loss: Above the $62,500 level to allow some room for potential volatility.
Target: First target at $56,000 (next significant volume node), second target at $50,000 (support zone and 1.618 Fibonacci extension).
Conclusion:
This trade setup leverages technical analysis tools to identify a high-probability short entry point. As always, ensure proper risk management and adjust the trade parameters based on market conditions.
In this analysis, I present a short trade setup for BTC/USD with an entry point around $61,000. This idea is based on the confluence of volume profile levels and Fibonacci retracement zones.
Volume Profile Analysis:
The volume profile indicates significant trading activity around the $61,000 level, which suggests it as a strong resistance zone. This implies that there may be considerable selling pressure once the price reaches this level.
Fibonacci Retracement:
Applying the Fibonacci retracement from the swing high to the recent swing low, the 0.618 retracement level aligns closely with the $61,000 mark. This confluence adds strength to the resistance at this level, providing a high-probability short entry.
RSI and ADX Indicators:
The Relative Strength Index (RSI) is currently showing bearish divergence, indicating a potential reversal or pullback.
The Average Directional Index (ADX) is at a high level, suggesting a strong trend which could soon see a correction.
Trade Setup:
Entry: Short at $61,000
Stop Loss: Above the $62,500 level to allow some room for potential volatility.
Target: First target at $56,000 (next significant volume node), second target at $50,000 (support zone and 1.618 Fibonacci extension).
Conclusion:
This trade setup leverages technical analysis tools to identify a high-probability short entry point. As always, ensure proper risk management and adjust the trade parameters based on market conditions.

면책사항
해당 정보와 게시물은 금융, 투자, 트레이딩 또는 기타 유형의 조언이나 권장 사항으로 간주되지 않으며, 트레이딩뷰에서 제공하거나 보증하는 것이 아닙니다. 자세한 내용은 이용 약관을 참조하세요.
면책사항
해당 정보와 게시물은 금융, 투자, 트레이딩 또는 기타 유형의 조언이나 권장 사항으로 간주되지 않으며, 트레이딩뷰에서 제공하거나 보증하는 것이 아닙니다. 자세한 내용은 이용 약관을 참조하세요.