
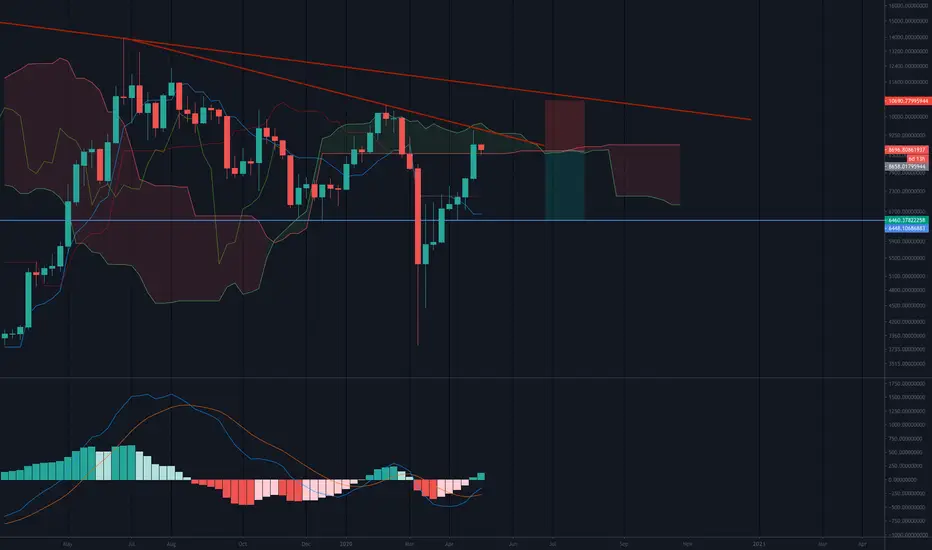
- The past 7 weeks have been green candles fully recovering from the big drop in early March.
- Price is now testing resistance against a downwards trendline
- While MACD is up, Ichimoku Cloud indicator suggests downwards pressure. Price is inside the cloud, suggesting lack of clear direction. Cloud future is red suggesting bear sentiment. Tenkan-san line (blue MA) is below the Kijun-san line (red MA) also suggesting bear sentiment.
...yet the monthly closed very bullish:
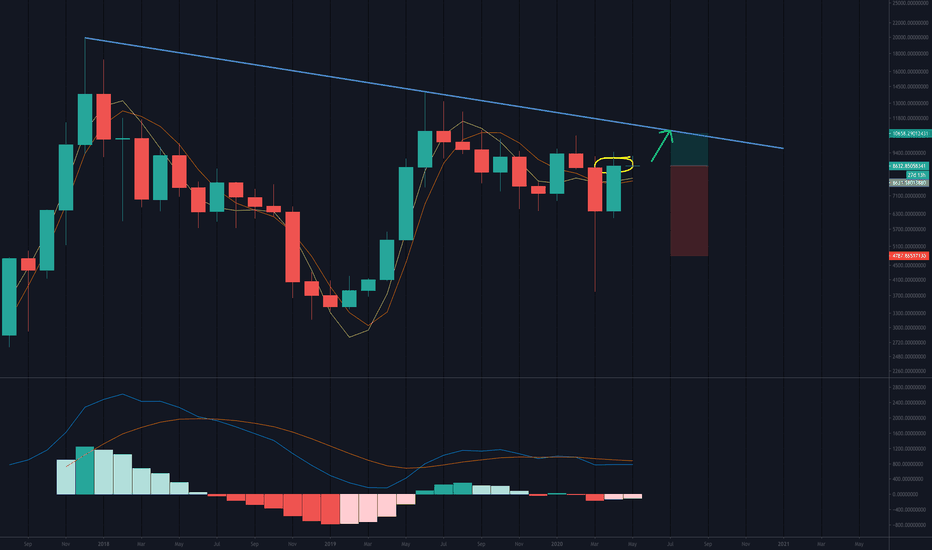
With strong support some 25% lower than current price, and halving taking place next week, we watch and wait...
Best guess at this point: price drops in first half of May's candle and then recovers to close near its high, ready for an April rally.
User our backtesting tool to help decide exact entry and exit points.

면책사항
해당 정보와 게시물은 금융, 투자, 트레이딩 또는 기타 유형의 조언이나 권장 사항으로 간주되지 않으며, 트레이딩뷰에서 제공하거나 보증하는 것이 아닙니다. 자세한 내용은 이용 약관을 참조하세요.
면책사항
해당 정보와 게시물은 금융, 투자, 트레이딩 또는 기타 유형의 조언이나 권장 사항으로 간주되지 않으며, 트레이딩뷰에서 제공하거나 보증하는 것이 아닙니다. 자세한 내용은 이용 약관을 참조하세요.