
Hello and a warm welcome to this analysis on BTCUSDT
On daily time frame we can see
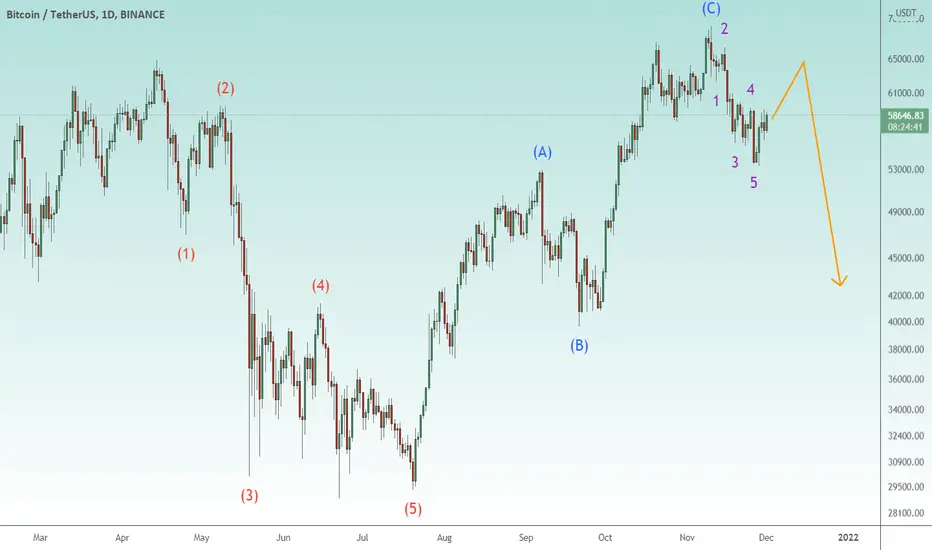
5 waves down - Wave A from APRIL 2021 to JULY 2021
followed by
Corrective abc up - Wave B from JULY 2021 to NOV 2021 which looks like a double top/horizontal B
then another
Minute impulse down - Wave 1 of C
currently it appears to be making Wave 2 of C which could retrace till 62000-64000 to be followed by Wave 3 of C down till approx 43000.
The view would be invalid if it prints a new high.
Short on rallies accordingly.
On daily time frame we can see
5 waves down - Wave A from APRIL 2021 to JULY 2021
followed by
Corrective abc up - Wave B from JULY 2021 to NOV 2021 which looks like a double top/horizontal B
then another
Minute impulse down - Wave 1 of C
currently it appears to be making Wave 2 of C which could retrace till 62000-64000 to be followed by Wave 3 of C down till approx 43000.
The view would be invalid if it prints a new high.
Short on rallies accordingly.

면책사항
해당 정보와 게시물은 금융, 투자, 트레이딩 또는 기타 유형의 조언이나 권장 사항으로 간주되지 않으며, 트레이딩뷰에서 제공하거나 보증하는 것이 아닙니다. 자세한 내용은 이용 약관을 참조하세요.
면책사항
해당 정보와 게시물은 금융, 투자, 트레이딩 또는 기타 유형의 조언이나 권장 사항으로 간주되지 않으며, 트레이딩뷰에서 제공하거나 보증하는 것이 아닙니다. 자세한 내용은 이용 약관을 참조하세요.