
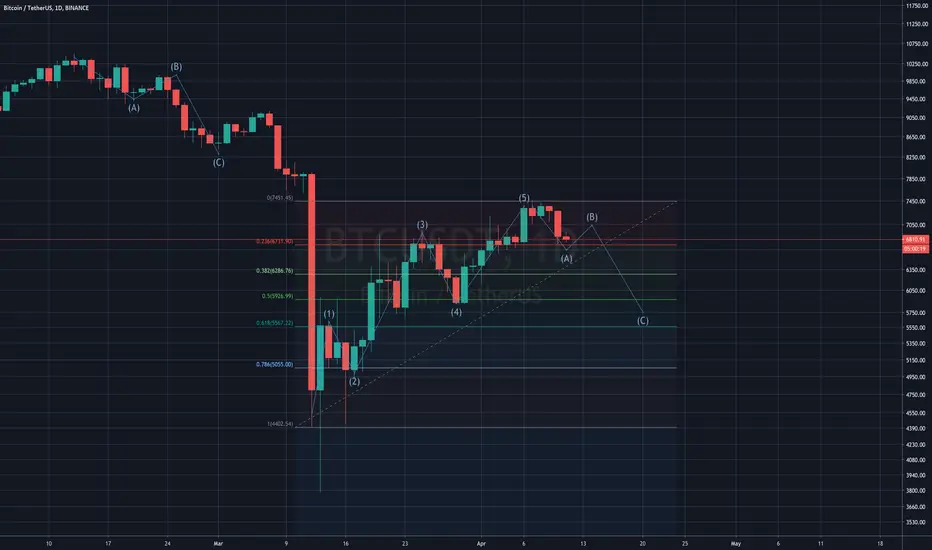
For me, the possible movements of the trend with the application of Elliott's rules are those of the graph. Bitcoins have not broken the resistance at 7,400k USD, by interpolating Elliot's main wave of impulse (Step 5). So now the price follows the waves (ABC) and now it's on (A). The Elliott wave indicates a possible path and price levels, which corresponds exactly to the Fibo graph plotted on the beginning of the pulse wave. Hence it is desirable that in case of bearish the price will go to 6.3 and 5.8k USD. Probably in the next few days.
#surfthetrend
#surfthetrend
액티브 트레이드
Bull Trap... 액티브 트레이드
Target (B) Reached, Now let's see what happens.액티브 트레이드
Wave B: Reached액티브 트레이드
Corrective and ZigZag into (Master Waves section (A-B)액티브 트레이드
Bearish Divergences 액티브 트레이드
H&S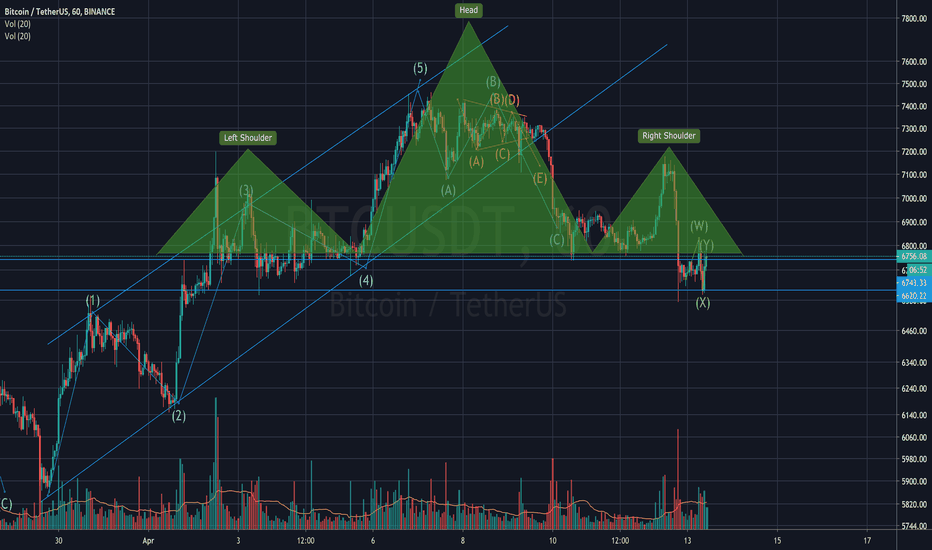
액티브 트레이드
Hidden divergence has preannunciament this movement 노트
Wave + Correction Triangle, Top Flat, Bottom rising.
관련 발행물
면책사항
해당 정보와 게시물은 금융, 투자, 트레이딩 또는 기타 유형의 조언이나 권장 사항으로 간주되지 않으며, 트레이딩뷰에서 제공하거나 보증하는 것이 아닙니다. 자세한 내용은 이용 약관을 참조하세요.
관련 발행물
면책사항
해당 정보와 게시물은 금융, 투자, 트레이딩 또는 기타 유형의 조언이나 권장 사항으로 간주되지 않으며, 트레이딩뷰에서 제공하거나 보증하는 것이 아닙니다. 자세한 내용은 이용 약관을 참조하세요.