
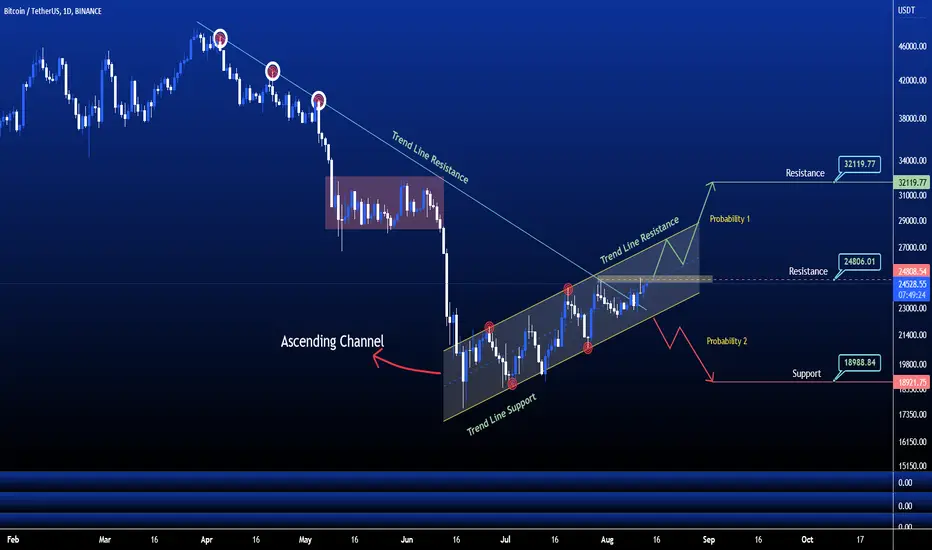
The above chart of Bitcoin laid out an ascending channel pattern. Ascending channel also known as the rising channel. The upper and lower trend lines that connect the higher highs and higher lows respectively appear to move within a rising slope. This pattern is generally a characteristic of a bullish trend.
Currently, Bitcoin (BTC) is in the range of $24515. If the pattern continues, the price of BTC might reach the resistance levels of $32119.If the trend reverses, then the price of BTC may fall to $18988
Comment your direction Probability 1 or Probability 2 ?
Currently, Bitcoin (BTC) is in the range of $24515. If the pattern continues, the price of BTC might reach the resistance levels of $32119.If the trend reverses, then the price of BTC may fall to $18988
Comment your direction Probability 1 or Probability 2 ?
노트
노트

관련 발행물
면책사항
해당 정보와 게시물은 금융, 투자, 트레이딩 또는 기타 유형의 조언이나 권장 사항으로 간주되지 않으며, 트레이딩뷰에서 제공하거나 보증하는 것이 아닙니다. 자세한 내용은 이용 약관을 참조하세요.
관련 발행물
면책사항
해당 정보와 게시물은 금융, 투자, 트레이딩 또는 기타 유형의 조언이나 권장 사항으로 간주되지 않으며, 트레이딩뷰에서 제공하거나 보증하는 것이 아닙니다. 자세한 내용은 이용 약관을 참조하세요.