
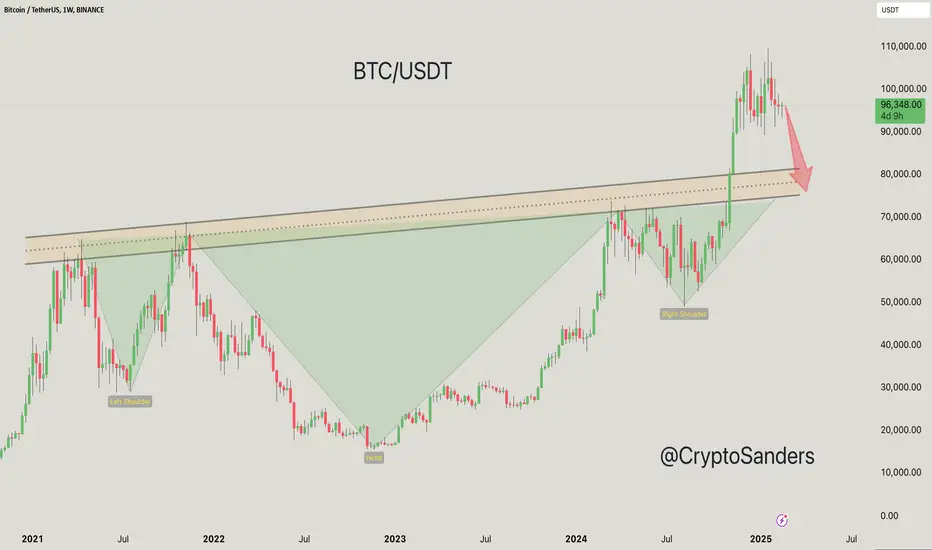
The price is around $96,063, hovering near the resistance zone slightly below $100,000. This indicates that the market is still testing higher levels.
Potential Head & Shoulders Pattern:
This formation appears to be a head and shoulders pattern, which is often seen as a bearish reversal signal. The left shoulder, head, and right shoulder are recognizable, and a breakdown could indicate downward momentum.
The overhead resistance barrier near $100,000 has proven challenging, and failure to break this level could increase selling pressure.
If the price declines, the chart suggests looking at support around $80,000. This level appears to be crucial for maintaining upward momentum.
Green areas indicate bullish momentum in previous cycles, but if the current pattern persists, some traders may start positioning for a potential decline.
Traders should keep an eye out for a breakout above $100,000 for bullish confirmation or a decline below support levels around $80,000, which could signal entering a bearish trend. Keep an eye on volume and market sentiment as these can significantly influence price movements.
If you found this analysis helpful, hit the Like button and share your thoughts or questions in the comments below. Your feedback matters!
Thanks for your support!
DYOR. NFA
Potential Head & Shoulders Pattern:
This formation appears to be a head and shoulders pattern, which is often seen as a bearish reversal signal. The left shoulder, head, and right shoulder are recognizable, and a breakdown could indicate downward momentum.
The overhead resistance barrier near $100,000 has proven challenging, and failure to break this level could increase selling pressure.
If the price declines, the chart suggests looking at support around $80,000. This level appears to be crucial for maintaining upward momentum.
Green areas indicate bullish momentum in previous cycles, but if the current pattern persists, some traders may start positioning for a potential decline.
Traders should keep an eye out for a breakout above $100,000 for bullish confirmation or a decline below support levels around $80,000, which could signal entering a bearish trend. Keep an eye on volume and market sentiment as these can significantly influence price movements.
If you found this analysis helpful, hit the Like button and share your thoughts or questions in the comments below. Your feedback matters!
Thanks for your support!
DYOR. NFA

관련 발행물
면책사항
해당 정보와 게시물은 금융, 투자, 트레이딩 또는 기타 유형의 조언이나 권장 사항으로 간주되지 않으며, 트레이딩뷰에서 제공하거나 보증하는 것이 아닙니다. 자세한 내용은 이용 약관을 참조하세요.
관련 발행물
면책사항
해당 정보와 게시물은 금융, 투자, 트레이딩 또는 기타 유형의 조언이나 권장 사항으로 간주되지 않으며, 트레이딩뷰에서 제공하거나 보증하는 것이 아닙니다. 자세한 내용은 이용 약관을 참조하세요.