
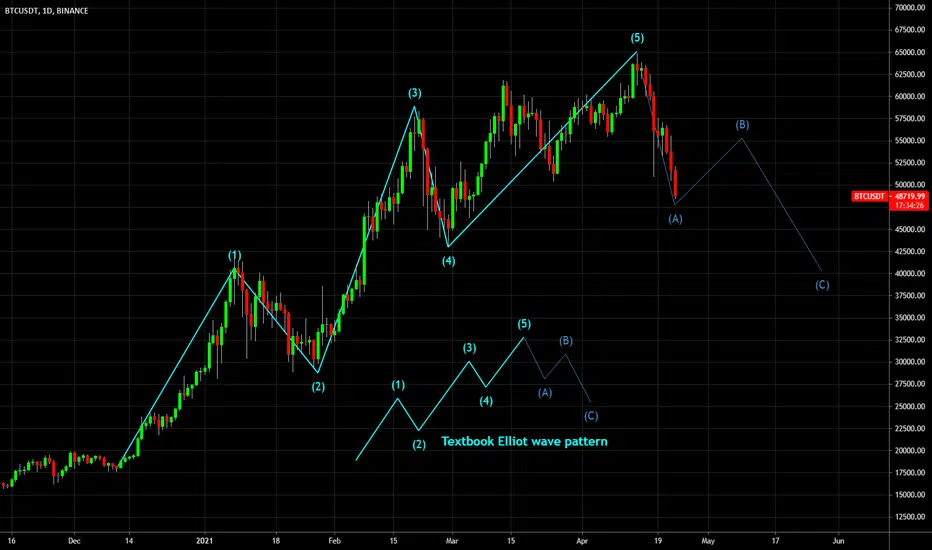
After reaching $65k last week, it appears that BTC has topped, at least for the near term. See my previous analysis on that:

Looking back, we can now safely say that the bullish Elliot wave pattern has finished and that we're currently in the first corrective wave A of the Elliot wave theory. Be aware that point A on the chart might go lower from here, I put it there for illustration. It has to stay above point 4 for the theory to be valid.
Assuming that the Elliot wave theory holds, we might soon see a recovery of the price towards the $55k area. In the end, this correction could launch us back towards $40k, potentially even lower, before starting a new bullish push. I'm still bullish for the remainder of the year, but this might be the first strong correction of the current bull-run.
Happy trading!

🎯Official Channel: t.me/FieryTradingChannel
📈Try my Premium Signals for FREE - 80% Win-Rate: t.me/FT_Futures_free
✅Monster Signals: t.me/monster_cryptosignals
🔥Premium Signals: fierytrading.com
📈Try my Premium Signals for FREE - 80% Win-Rate: t.me/FT_Futures_free
✅Monster Signals: t.me/monster_cryptosignals
🔥Premium Signals: fierytrading.com
관련 발행물
면책사항
해당 정보와 게시물은 금융, 투자, 트레이딩 또는 기타 유형의 조언이나 권장 사항으로 간주되지 않으며, 트레이딩뷰에서 제공하거나 보증하는 것이 아닙니다. 자세한 내용은 이용 약관을 참조하세요.