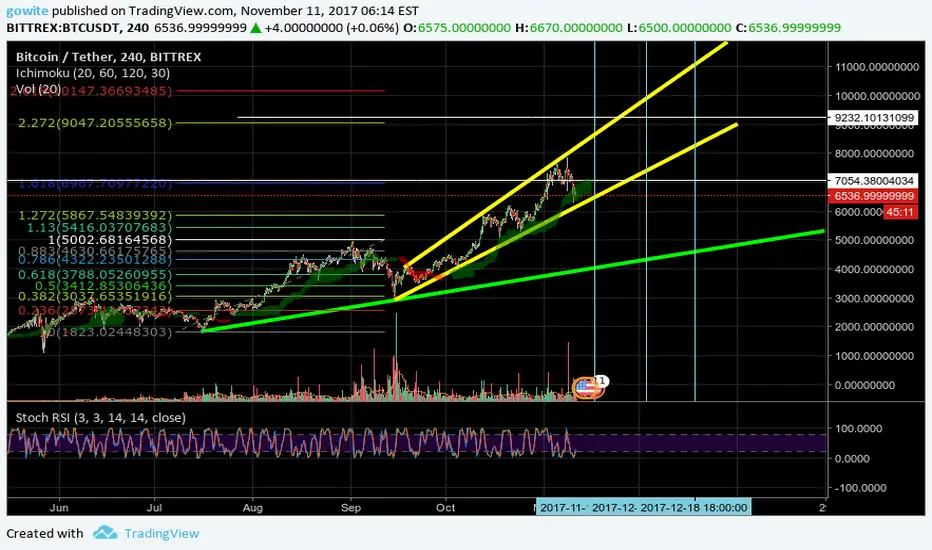
BTC followed a correction around 1.618 fib line, at least, it didn't sold under support line.
It is still in support zone. At this value, 500 usdt drops are not something huge in percentage.
The next zones that can will possibly encounter resistance are fibs 2.272-2.618 and especially 3.618.
It seems that momentum is also shaking, so it's a risky area.
If it sells under yellow support line, it can go down as more as red support line shows.
Blue lines indicate possible downtrend start days.
Remember hope for the best and prepare for the worst.
It is still in support zone. At this value, 500 usdt drops are not something huge in percentage.
The next zones that can will possibly encounter resistance are fibs 2.272-2.618 and especially 3.618.
It seems that momentum is also shaking, so it's a risky area.
If it sells under yellow support line, it can go down as more as red support line shows.
Blue lines indicate possible downtrend start days.
Remember hope for the best and prepare for the worst.

면책사항
해당 정보와 게시물은 금융, 투자, 트레이딩 또는 기타 유형의 조언이나 권장 사항으로 간주되지 않으며, 트레이딩뷰에서 제공하거나 보증하는 것이 아닙니다. 자세한 내용은 이용 약관을 참조하세요.
면책사항
해당 정보와 게시물은 금융, 투자, 트레이딩 또는 기타 유형의 조언이나 권장 사항으로 간주되지 않으며, 트레이딩뷰에서 제공하거나 보증하는 것이 아닙니다. 자세한 내용은 이용 약관을 참조하세요.