
#Crack #Bitcoin #Binance #Daily
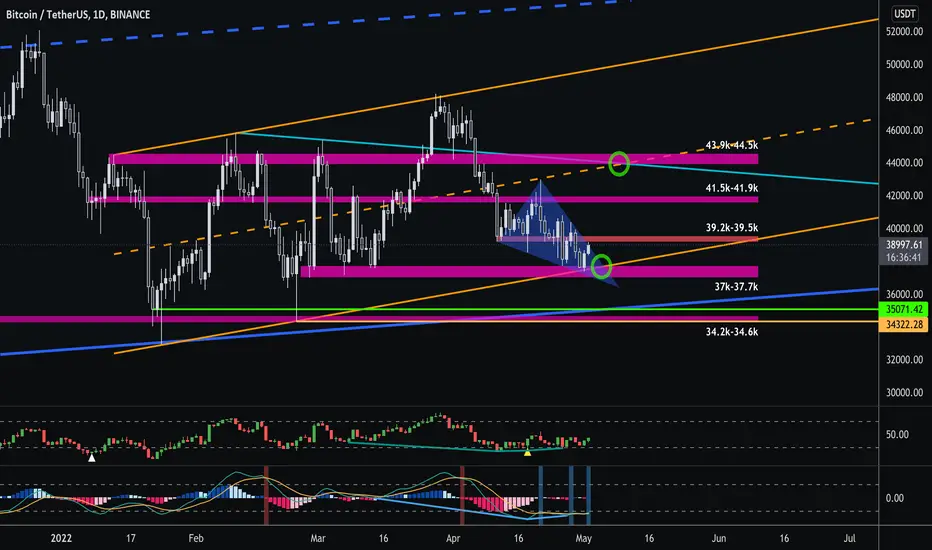
- It looks like a rebound is emerging from the $37k-$37.7k I mentioned over and over again.
- Bitcoin is showing a strong rebound since the low of $37,386 the day before, and seems to be trying to break out the resistance above the blue bearish wedge.
- A break of the $39.2k-$39.5k resistance seems important if the break above the blue bearish wedge. If that resistance is not broken, we should keep in mind the possibility of retest support at the intersection of the upper wedge, $37.7k and the lower orange bull trend channel.
- If the retest support is successful after being pressed, the three golden crosses of the RACD indicator will also serve as a strong bull trend. At this time, the long-term target price can be expected to rise to the resistance of $43.9k-$44.5k, which is the overlapping section of the orange bull trend centerline, the sky blue high-trend line and $43.9k.
- However, it is recommended to carefully examine the $41.5k-$41.9k resistor located before $43.9k-$44.5k.
- If the $37k-$37.7k support fails, $34.2k-$34.6k support is very important, and if the $34,322 low is renewed, the possibility of a big bear trend should be taken into account as the breakout of the lower blue long-term bull trend channel is possible.
- It looks like a rebound is emerging from the $37k-$37.7k I mentioned over and over again.
- Bitcoin is showing a strong rebound since the low of $37,386 the day before, and seems to be trying to break out the resistance above the blue bearish wedge.
- A break of the $39.2k-$39.5k resistance seems important if the break above the blue bearish wedge. If that resistance is not broken, we should keep in mind the possibility of retest support at the intersection of the upper wedge, $37.7k and the lower orange bull trend channel.
- If the retest support is successful after being pressed, the three golden crosses of the RACD indicator will also serve as a strong bull trend. At this time, the long-term target price can be expected to rise to the resistance of $43.9k-$44.5k, which is the overlapping section of the orange bull trend centerline, the sky blue high-trend line and $43.9k.
- However, it is recommended to carefully examine the $41.5k-$41.9k resistor located before $43.9k-$44.5k.
- If the $37k-$37.7k support fails, $34.2k-$34.6k support is very important, and if the $34,322 low is renewed, the possibility of a big bear trend should be taken into account as the breakout of the lower blue long-term bull trend channel is possible.

토미 유튜브: youtube.com/@TommyTradingTV
제 모든 인사이트, 분석, 관점은 t.me/tommy_trading 에 가장 먼저 올라갑니다!
제 모든 인사이트, 분석, 관점은 t.me/tommy_trading 에 가장 먼저 올라갑니다!
관련 발행물
면책사항
해당 정보와 게시물은 금융, 투자, 트레이딩 또는 기타 유형의 조언이나 권장 사항으로 간주되지 않으며, 트레이딩뷰에서 제공하거나 보증하는 것이 아닙니다. 자세한 내용은 이용 약관을 참조하세요.
토미 유튜브: youtube.com/@TommyTradingTV
제 모든 인사이트, 분석, 관점은 t.me/tommy_trading 에 가장 먼저 올라갑니다!
제 모든 인사이트, 분석, 관점은 t.me/tommy_trading 에 가장 먼저 올라갑니다!
관련 발행물
면책사항
해당 정보와 게시물은 금융, 투자, 트레이딩 또는 기타 유형의 조언이나 권장 사항으로 간주되지 않으며, 트레이딩뷰에서 제공하거나 보증하는 것이 아닙니다. 자세한 내용은 이용 약관을 참조하세요.