
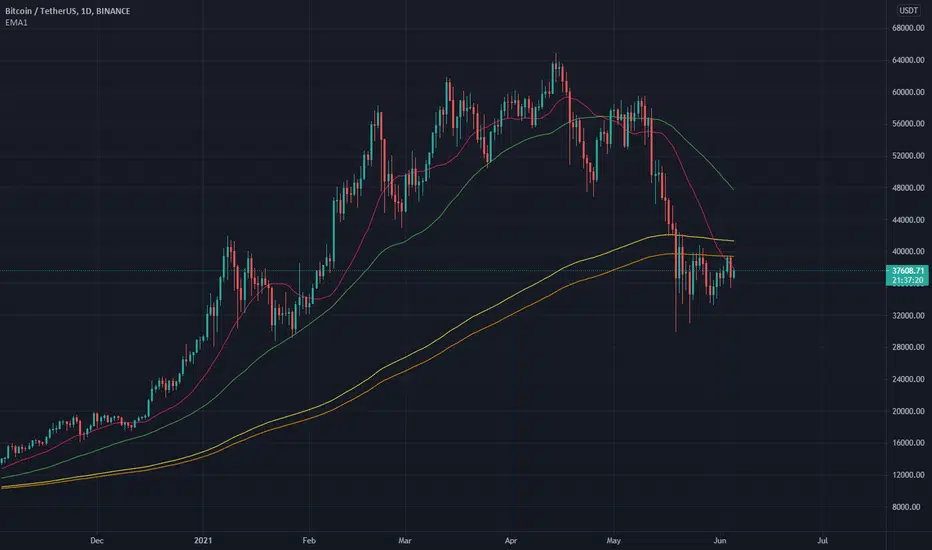
On the 1 day chart, Bitcoin is now below the 200 and the 233 EMA . (yellow and orange)
The 20 SMA (pink) has met the consolidation triangle at the top of the current candle. Usually the price of bitcoin follows the 20 SMA closely if you look at the past price action.
Yesterday we had a bearish engulfing candle.
With the combination of these things, I would expect continuation to the downside today.
The 20 SMA (pink) has met the consolidation triangle at the top of the current candle. Usually the price of bitcoin follows the 20 SMA closely if you look at the past price action.
Yesterday we had a bearish engulfing candle.
With the combination of these things, I would expect continuation to the downside today.
노트
You can also draw trend lines on indicators/oscillators. Looking at this oscillator, it looks like we have reached the top of the trend and would be ready for a move back down soon 노트
노트
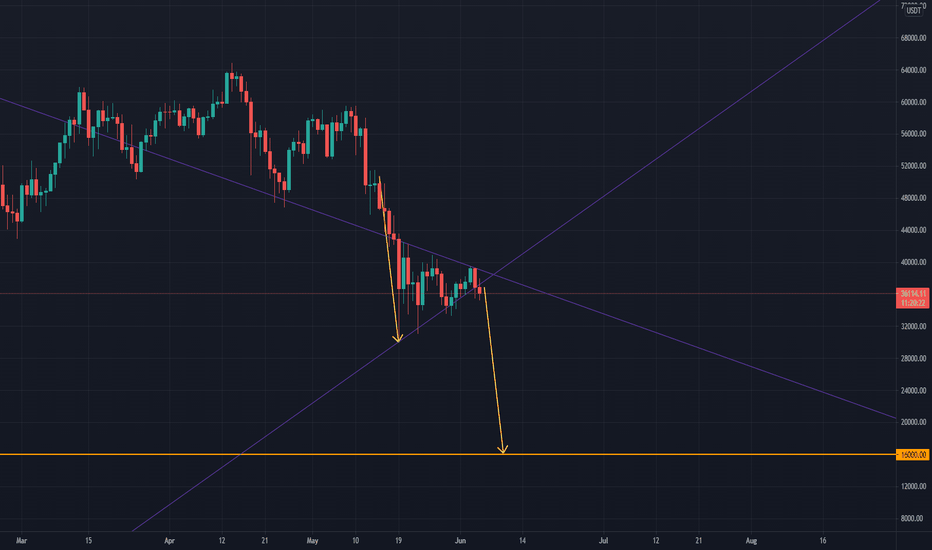
Looks like we fell out of the triangle on the 3 day chart 노트
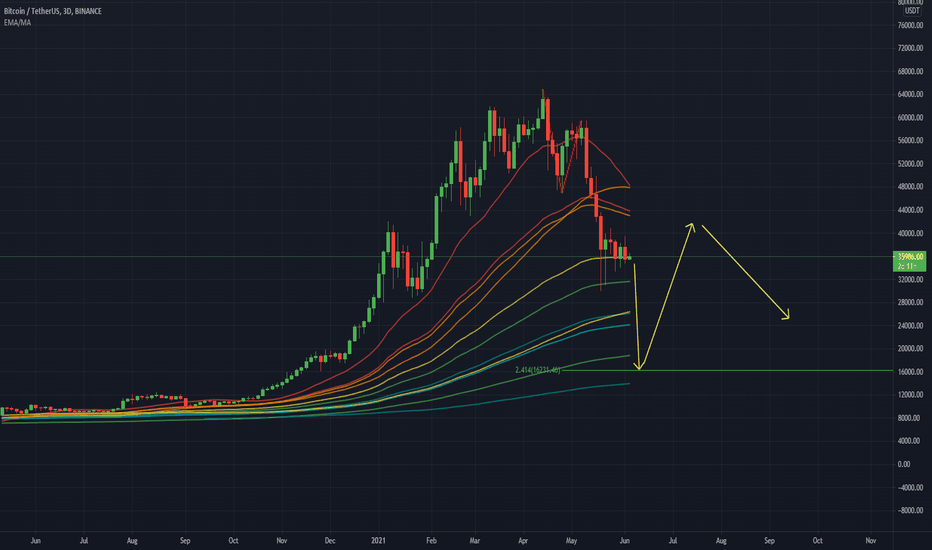
Looks like plenty of downside ahead on the Volume Supported Linear Regression 노트

면책사항
해당 정보와 게시물은 금융, 투자, 트레이딩 또는 기타 유형의 조언이나 권장 사항으로 간주되지 않으며, 트레이딩뷰에서 제공하거나 보증하는 것이 아닙니다. 자세한 내용은 이용 약관을 참조하세요.
면책사항
해당 정보와 게시물은 금융, 투자, 트레이딩 또는 기타 유형의 조언이나 권장 사항으로 간주되지 않으며, 트레이딩뷰에서 제공하거나 보증하는 것이 아닙니다. 자세한 내용은 이용 약관을 참조하세요.