
Daily chart:
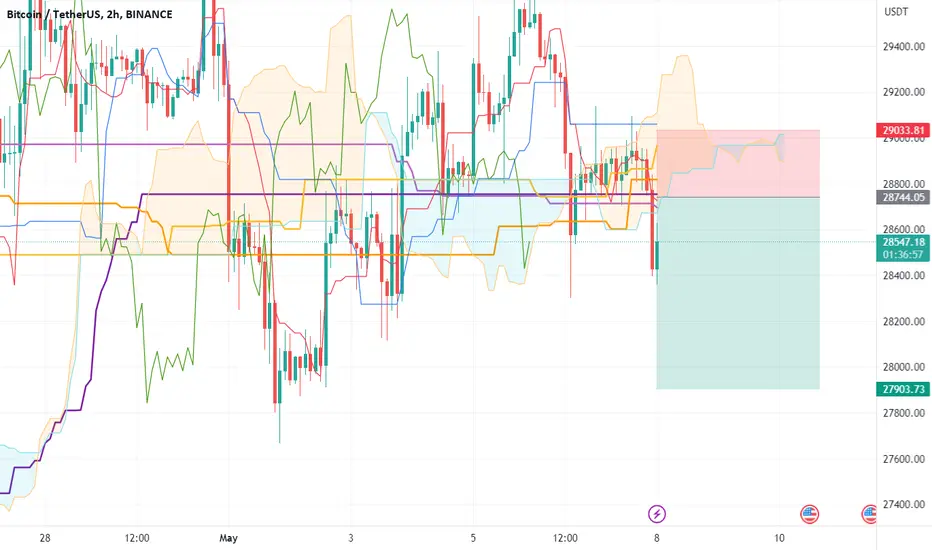
price equilibrium is the 29000 Kijun line, the price is below the Kijun line. Although the daily candle has not closed yet, the current position of the price is entering the cloud.
These two shows that selling is dominating. However, if the price crosses the Kijun line, be careful.
H4 chart:
If the price closes below 28400 and is confirmed, the sellers have the upper hand.
You can enter the sell side with the target at 27800, and stop loss at 29150.
price equilibrium is the 29000 Kijun line, the price is below the Kijun line. Although the daily candle has not closed yet, the current position of the price is entering the cloud.
These two shows that selling is dominating. However, if the price crosses the Kijun line, be careful.
H4 chart:
If the price closes below 28400 and is confirmed, the sellers have the upper hand.
You can enter the sell side with the target at 27800, and stop loss at 29150.
거래청산: 타겟 닿음

면책사항
해당 정보와 게시물은 금융, 투자, 트레이딩 또는 기타 유형의 조언이나 권장 사항으로 간주되지 않으며, 트레이딩뷰에서 제공하거나 보증하는 것이 아닙니다. 자세한 내용은 이용 약관을 참조하세요.
면책사항
해당 정보와 게시물은 금융, 투자, 트레이딩 또는 기타 유형의 조언이나 권장 사항으로 간주되지 않으며, 트레이딩뷰에서 제공하거나 보증하는 것이 아닙니다. 자세한 내용은 이용 약관을 참조하세요.